
Zapmap Counts 3.4 Percent Fewer Rapid Chargers in Three Months as Ultra-Rapid Ones Overtake
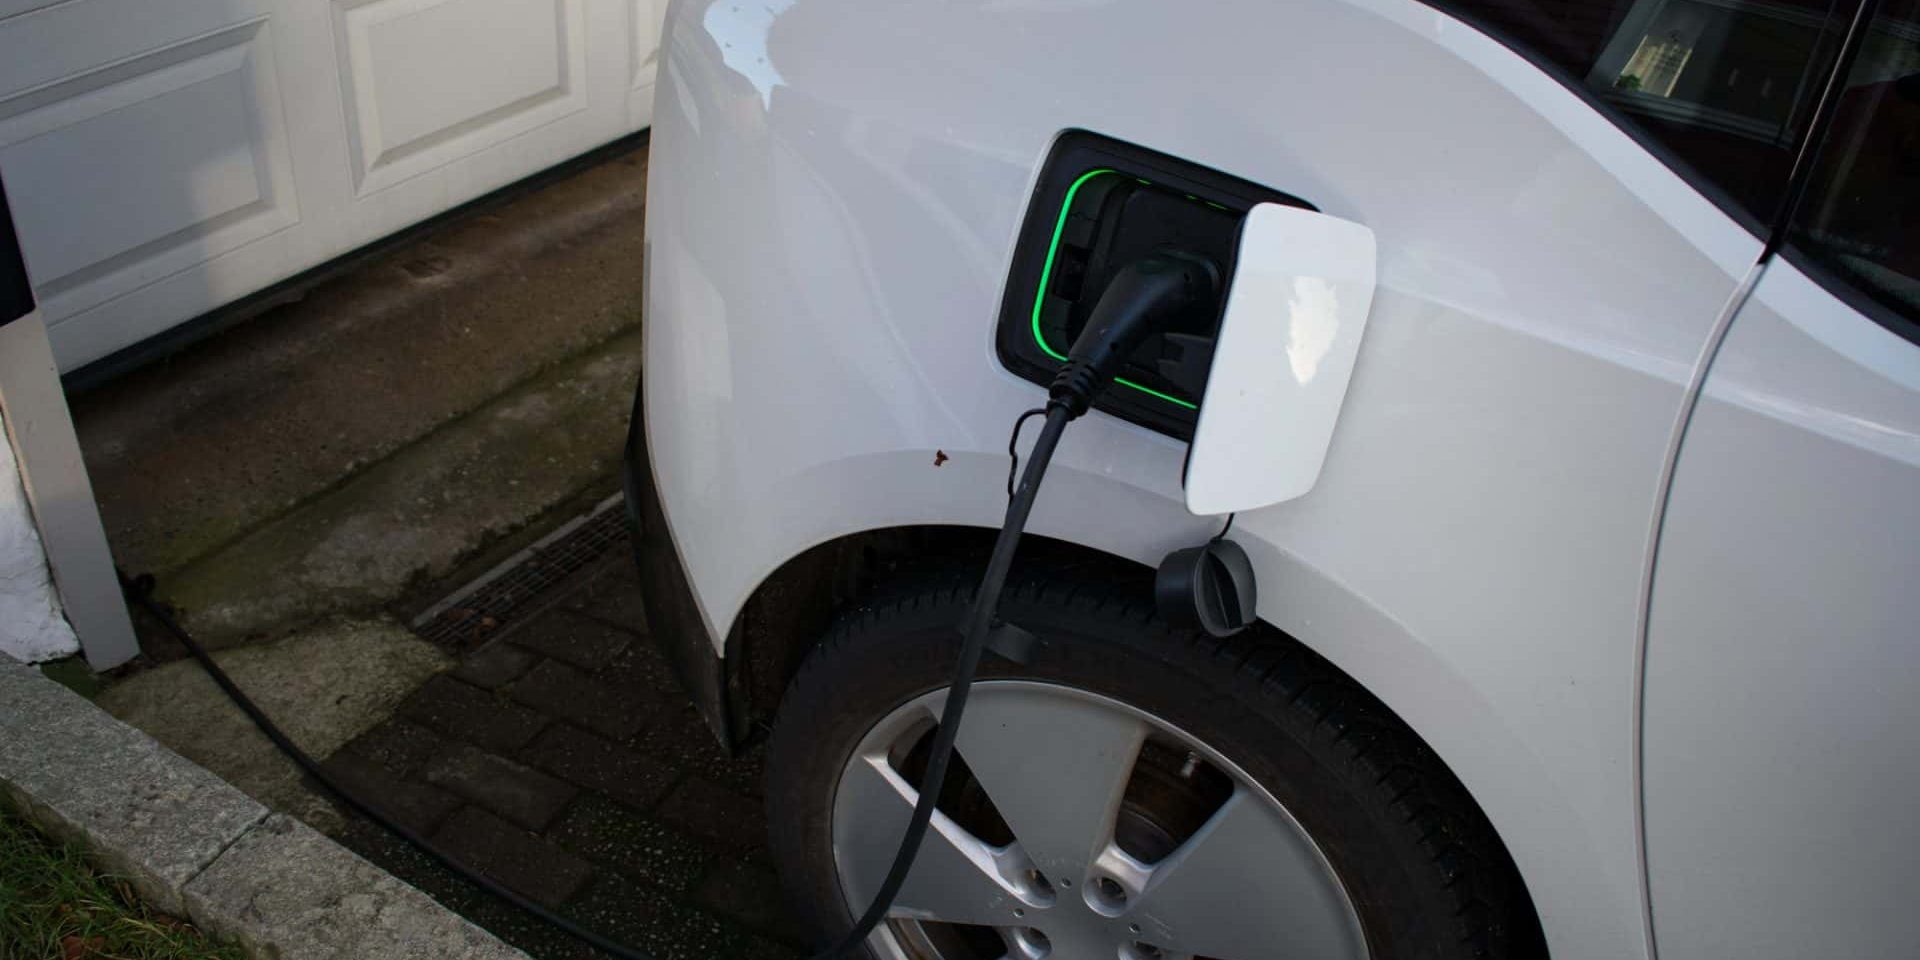

- Zapmap’s count of public EV chargers reached 124,738 at the end of September 2026, up 3,567 (2.9 percent) on the end of June and 9 percent on a year earlier.
- Rapid chargers (50kW to 149kW) fell by 504, or 3.4 percent, to 14,387 in the quarter, while ultra-rapid chargers (150kW and above) rose by 1,339, or 9.6 percent, to 15,335.
- Rapid and ultra-rapid chargers grew 22.84 percent in a year in the North East and 9.03 percent in Scotland, the slowest of the 12 regions.
Ultra-Rapid Chargers Pulled Ahead of Rapid Ones Between July and September
At the end of June 2026 the Zapmap database listed 14,891 rapid chargers, rated 50kW to 149kW, and 13,996 ultra-rapid chargers, rated 150kW and above. By the end of September the order had flipped: 14,387 rapid and 15,335 ultra-rapid. That is 504 fewer rapid chargers, a fall of 3.4 percent, and 1,339 more ultra-rapid ones, a rise of 9.6 percent, in three months.
Ultra-rapid chargers now make up 51.6 percent of the 29,722 chargers rated 50kW or more, up from 48.5 percent in June. The whole network grew by 3,567 chargers in the quarter, from 121,171 to 124,738. Standard chargers, under 50kW, added 2,732 (3.0 percent) to reach 95,016 and still make up more than three in four of everything on the map.
Over a full year the gap is wider. Rapid chargers slipped from 14,570 to 14,387, down 183 or 1.3 percent, while ultra-rapid chargers climbed from 11,020 to 15,335, up 4,315 or 39.1 percent. In June the rapid band was still 2.1 percent up on a year earlier (14,587 to 14,891), so on a yearly basis the band went from growth to decline inside a single quarter.
What Sits Behind a 504 Charger Drop in Zapmap’s Database
Zapmap counts the chargers added to its platform and subtracts those removed from it, so the rapid figure is a net number. The company names one cause for the weak rapid band: units are being upgraded to higher power ratings. A charger upgraded to 150kW or more leaves the rapid count and joins the ultra-rapid count. The October release does not say how many of the 504 were upgrades, so the figure cannot be read as 504 chargers switched off.
Other forces move the count from quarter to quarter. In July Jade Edwards of Zapmap listed three: operators tightening the quality of the data they pass to services such as Zapmap in response to the Public Charge Point Regulations, poorly performing chargers being taken out of public use, and chargers dropping out of view for a time while they move from one back office or network to another. The October release does not say how much of the rapid fall each one explains.
Definitions moved too. From February 2026 Zapmap leads with individual chargers rather than devices, matching the way the Department for Transport now reports official public charging statistics. The old Slow and Fast power bands became Standard and Standard Plus, and the way hubs are categorised changed, so counts do not always match figures Zapmap published before February 2026. A driver comparing this quarter with an older headline should expect gaps.
The pace of building has eased as well. Zapmap logged 5,119 new chargers in the first half of 2026 and 8,686 over the first nine months, which leaves 3,567 for the third quarter. Growth on a year earlier stood at 10 percent at the end of June and 9 percent at the end of September. In July Melanie Shufflebotham, co-founder and COO of Zapmap, said growth of the charging network was lower than in the past couple of years. She tied the change to a move from the rush for prime locations to more considered expansion and more mergers and acquisitions among charge point operators.
Where the New Ultra-Rapid Chargers Opened
The hubs, defined as sites with eight or more rapid or ultra-rapid chargers and excluding Tesla non-public hubs, reached 1,070 at the end of September. That is 36 more than the 1,034 in June and 220 more than the 850 a year earlier. Zapmap has added 144 hubs so far in 2026, against 108 at the half-year mark.
Four openings stand out in the quarter. Moto’s Tamworth services on the M42 has 12 ultra-rapid chargers under the Moto CHARGE brand. GRIDSERVE’s fifth Electric Forecourt, at Markham Vale on the M1 in Derbyshire, has 39. The bp pulse site at Tingley West in Yorkshire has 19, plus a pull-through bay for trailers and caravans. Fastned’s 40th UK hub, at Brunswick Business Park in Liverpool, has eight. Together that is 78 ultra-rapid chargers on four sites.
Chargers built for long trips grew fastest by use. En-route chargers number 14,053, up 23.1 percent on a year ago and up 342 (2.5 percent) from 13,711 in June. Destination chargers, at shops, gyms, restaurants and theme parks, number 64,289, up 4.26 percent on a year and 1,680 (2.7 percent) on the quarter. Zapmap says destination sites where drivers stay under four hours are installing more high-powered chargers, which feeds the ultra-rapid total. Shufflebotham says hubs are the most popular charging location among Zapmap’s EV driver community.
The North East Grew Fastest in a Year and Scotland Added the Most in a Quarter
Zapmap’s regional table covers rapid and ultra-rapid chargers together, 25,590 a year ago and 29,722 now, a rise of 16.15 percent. The North East leads on growth at 22.84 percent (823 to 1,011), followed by the East Midlands at 22.66 percent (1,814 to 2,225) and the West Midlands at 21.62 percent (2,442 to 2,970). Greater London added 19.48 percent (2,213 to 2,644) and the East of England 18.43 percent (2,719 to 3,220).
The biggest gains in raw numbers went elsewhere. The West Midlands added 528 chargers to reach 2,970, the South East 511 to reach 4,108 and the East of England 501 to reach 3,220. At the other end, Scotland grew 9.03 percent (3,156 to 3,441, up 285) and the South West 11.47 percent (2,633 to 2,935, up 302). Northern Ireland added the fewest chargers, 53 (315 to 368, up 16.83 percent).
Set Zapmap’s June table beside the September one and the quarter tells a different story for Scotland. It gained 164 rapid and ultra-rapid chargers between July and September (3,277 to 3,441, up 5.0 percent), more than any other region by count, and sits second to the South East on total numbers. The North East grew faster in percentage terms, up 6.3 percent (951 to 1,011). The West Midlands added 142 (2,828 to 2,970, up 5.0 percent) and Greater London 104 (2,540 to 2,644, up 4.1 percent). Northern Ireland went the other way, from 372 to 368, the only region with fewer chargers than in June.
About One in Three Public Chargers Now Sits on a Street
Zapmap puts on-street chargers, built for overnight or all day use by drivers who cannot park at home, at 41,374. That is 33.2 percent of the network, up 13.4 percent on a year ago and up 1,515 (3.8 percent) from 39,859 in June. Zapmap says about 40 percent of households have no off-street parking and that on-street charging is set to grow significantly. Most local authorities and combined authorities now hold an allocation from the Local Electric Vehicle Infrastructure (LEVI) fund, though many are still at tender, commercial contract or planning stage. The cost side for these households is covered in what drivers without a driveway pay.
Four contracts announced in the quarter cover at least 6,200 chargers: 3,000 across West Northamptonshire with char.gy, more than 1,000 in North Hertfordshire, St Albans and Welwyn Hatfield with Zest, over 900 in Bedford with Connected Kerb, and 1,300 across Devon and Torbay with Believ.
Shane Brennan, CEO of Charge UK, said: “The comparative slowness, combined with the cost disparity between home and public charging, risks exacerbating the ‘driveway divide’ between those who can charge at home and those who cannot.”
Zapmap’s own pricing data points the other way on running costs. In October it showed that even EV drivers with no home charging, who rely wholly on the public network, will often be better off than a driver of a comparative petrol or diesel car. The price comparison is covered in public charging against diesel.
What to Check Before You Plan a Charging Stop
Check the power rating of each charger on your route, not just its distance. Rapid means 50kW to 149kW and ultra-rapid means 150kW and above, and the band that shrank this quarter is rapid. A rapid stop you used in the summer can now carry a higher rating, or can have dropped out of view for a spell. Find your car’s maximum charging rate in the handbook and compare it with the rating shown for the charger you plan to use.
Prefer the 1,070 hubs for long trips. A site with eight or more rapid or ultra-rapid chargers gives you other units to try if one is out of use, and the four openings named above are the newest examples. Scotland and the South West posted the slowest yearly growth in rapid and ultra-rapid chargers and Northern Ireland lost four in the quarter, so check the live availability of the chargers on your route before you leave.
Price is the other half of the choice. Look at what drivers pay at rapid chargers before you commit to a stop. Zapmap publishes these counts quarterly, with releases on 8 January, 8 April, 6 July and 6 October 2026, so the next count will show whether rapid chargers kept falling or levelled off.
Want more car content? Add us as a preferred source on Google to your favourites list for the best automotive news and analysis on the internet.
If you enjoyed this article, be sure to follow us on Microsoft Start.

Leave a Comment
More in News

Sheffield Council Issued 88,577 Bus Lane Fines to Drivers and Cancelled 83 Percent More

Mercedes-AMG GT SUV Goes Electric With Up to 1,169hp and 710kW Charging

Glasgow Drivers Won 82 Percent of LEZ Appeals as Council Costs Passed Fine Income

Edinburgh Council Says 50 LEZ Debtors Owe Almost £530,000 as Fines Go Unpaid

How to Replace a Car Key Fob Battery (and What a Garage Charges)
Trending on Motoring Chronicle
Every UK Driver Now Risks a Moving Traffic Fine as 30 Councils Add Cameras

Why Washington Just Rolled Back Fuel Economy Rules on New Cars

£18.6 Billion in the Ground: Britain’s Pothole Crisis Is a National Disgrace. Here Is How to Claim For Damage

Why Catalytic Converter Theft Is Surging Again [and How to Protect Your Car]
