
Drivers Using Rapid EV Chargers Pay 79p a kWh, Up 4 Percent, Zapmap Shows
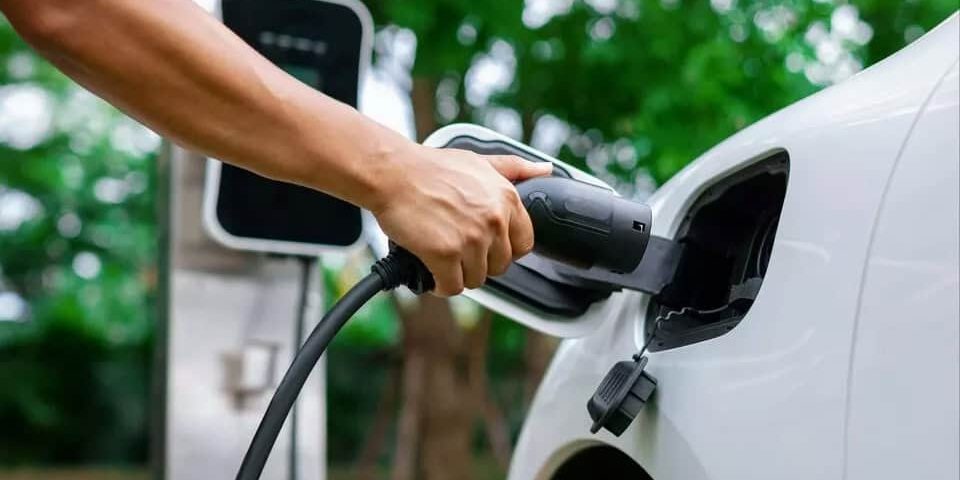
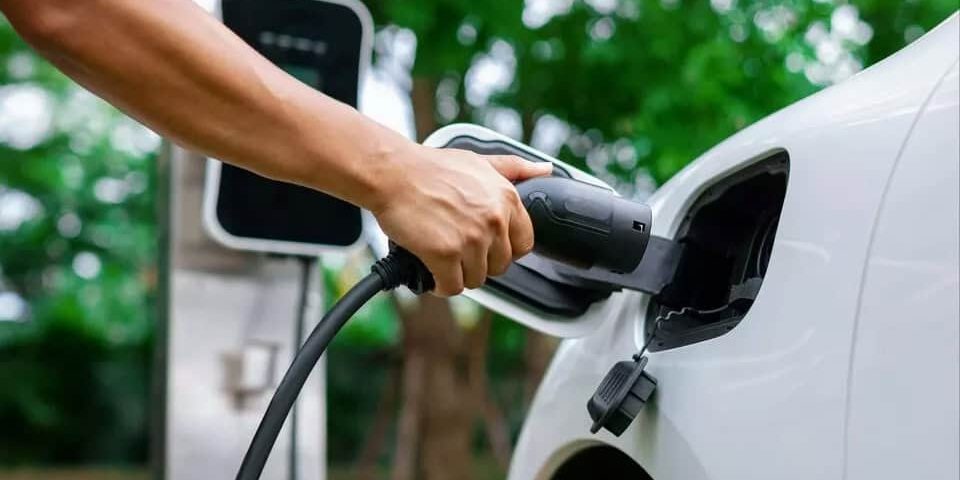
- Zapmap’s September 2026 Price Index puts the average pay-as-you-go price at 79p a kWh on rapid and ultra-rapid chargers, up around 4% on a year ago.
- Slower chargers (3kW to 49kW) average 54p a kWh, also up around 4%, which Zapmap converts to 16p a mile, against 24p a mile on rapid chargers for an average-efficiency electric car.
- Over 10,000 miles, charging only on rapid chargers works out at about £2,400 a year at Zapmap’s per-mile rate, £800 more than the £1,600 on slower public chargers (our calculation).
Public electric car charging costs more again. Zapmap’s Price Index, updated on 7 October 2026 with September data, shows drivers paying an average of 79p for every kWh from a rapid or ultra-rapid charger, with slower chargers averaging 54p. Both figures are up around 4% on a year ago, according to Zapmap’s own comparison.
Zapmap runs the index on usage data it says covers around 75% of UK public chargers, and it updates the figures every month. The prices are pay-as-you-go rates, meaning what a driver pays without a membership or a special deal. That is the price a driver faces when they pull up at an unfamiliar charger and tap a card or open an app.
Zapmap also turns the prices into a cost per mile for an average-efficiency electric car: 16p a mile on standard chargers and 24p a mile on rapid chargers. For a driver who covers 10,000 miles a year, that is the difference between £1,600 and £2,400, a gap of £800. Those annual totals are our own sums from Zapmap’s per-mile figures, not numbers the index publishes.
Why the Charger You Pick Changes the Bill by 46 Percent
The headline gap is between speeds. At 79p, a rapid or ultra-rapid kWh costs 25p more than the 54p average on standard and standard plus chargers, which Zapmap defines as 3kW to 49kW. That makes rapid charging about 46% dearer per kWh, a figure worked out from the two published prices.
Zapmap’s per-mile numbers carry the same gap. Dividing 24p by 79p and 16p by 54p gives roughly 0.3 kWh a mile in both cases, or about 3.3 miles from each kWh. The index does not explain exactly how the per-mile figures were calculated beyond saying they are for an average-efficiency electric car, so treat the mileage as a guide rather than a promise for any one model.
To see what that means at the charger, take a 60kWh top-up. This is an illustrative size we have picked, not a Zapmap figure. At the 54p standard average it costs £32.40. At the 79p rapid average it costs £47.40, which is £15 more for the same amount of energy.
The overall average and the network gap
Across all chargers, Zapmap says the average has risen to 75p a kWh, a level it describes as applying from September 2025. The index adds that the cost advantage over petrol and diesel has grown every month from June 2026, so the gap in favour of electric has widened over that period. The page expects promotions and competition to bring costs down over time, but gives no figures for that.
Individual networks sit well below the 79p rapid average. Zapmap lists Sainsbury’s Smart Charge at 72p a kWh, Believ at 66p, and Tesla Superchargers that are open to all drivers at 69p. Those are 7p, 13p and 10p below the rapid average respectively. On a 60kWh top-up, the difference between Believ and the average is £7.80.
The largest gap in the data is on Tesla’s own network. Zapmap shows Tesla Superchargers open to all drivers at 69p a kWh, while pricing for Tesla drivers only is 48p. A non-Tesla driver pays 21p more per kWh, or 44% more, for the same kind of charger. A 60kWh top-up is £12.60 dearer at the open price. Compared with the 79p rapid average, the Tesla-only price is 31p lower, or about 39% less.
All of these network prices are pay-as-you-go rates for rapid and ultra-rapid charging, apart from the Tesla-only price, which Zapmap lists in a series that includes Tesla-only chargers. The index does not give a regional breakdown, so it cannot say whether a driver in one part of the country pays more than another.
What the same miles cost at home
The index puts the home energy price cap at around 26p a kWh, which is a third of the 79p rapid average. Applying the same 0.3 kWh a mile used above, a mile at home works out at about 7.8p. Over 10,000 miles that is £780 a year, against £1,600 on standard public chargers and £2,400 on rapid ones. These are our calculations built on Zapmap’s own price and per-mile figures, and they assume a driver pays the standard rate with no special tariff.
Zapmap also states a fuel saving of £1,130 for a driver who does 20% of their charging on public chargers. The index does not set out the assumptions behind that number, so it is quoted here as Zapmap’s figure only. The wider point from the data is that the more charging a driver does in public, and the faster the charger, the smaller that advantage becomes.
The data has some loose ends. Zapmap gives different monthly session counts in different places on its page, ranging from 700,000 to nearly four million, so no session figure is used here. The index also shows no month-on-month change for September, only the comparison with a year ago.
Can You Avoid Paying 79p a kWh?
For many drivers the answer is partly yes, and the data points to four routes.
The first is to charge at home wherever possible. At around 26p a kWh against 54p to 79p in public, every home kWh costs less than half of a public one. A driver with a driveway or a wall charger has the clearest route to the lowest running cost. Drivers without off-street parking cannot do this, and for them the gap on public chargers is the number that counts.
The second is to match the charger to the stop. A rapid charger saves time but adds 25p a kWh on average. If a car is parked for a few hours at a supermarket, a gym or a workplace, a standard charger at 54p brings the cost to 16p a mile rather than 24p. Rapid charging earns its premium on long trips when time is the priority, and on those trips topping up to what is needed to reach the next stop rather than filling to the top avoids paying 79p for energy a driver does not need.
The third is to compare networks before plugging in. Believ at 66p and Tesla’s open Superchargers at 69p both undercut the 79p rapid average, and Sainsbury’s Smart Charge at 72p does too. A driver with two rapid chargers within reach can save 7p to 13p a kWh by choosing the cheaper network. On a 60kWh top-up that is between £4.20 and £7.80.
The fourth is to check whether a membership or a special deal applies. The index leaves these out, so the 79p and 54p averages are what a driver without one pays. Drivers who charge in public can often find a network’s own rate lower than its pay-as-you-go price, and Tesla drivers using Tesla’s network see the biggest gap in the data, at 48p against 69p for everyone else.
A simple check is to take the price per kWh on the charger screen and multiply it by about 0.3 to get a cost per mile for an average electric car, or use the actual kWh per mile from the car’s trip computer for a sharper number. If it comes out above 24p a mile, the charger is dearer than the rapid average. If it comes out near 16p, it is in line with the standard average.
Zapmap describes the index as an average of pay-as-you-go prices adjusted for how much energy each network delivers, so a cheap network with few sessions counts for less than a large network with many. That means the averages reflect where drivers actually charge, not a simple list of the cheapest prices. A driver who uses one network heavily should look at that network’s own price rather than the national average.
Zapmap says the index is based on around 75% of UK public chargers and updates every month, so the next release will show whether the 4% year-on-year rise continues.
Sources:

Leave a Comment
More in News

How Bus Lane Cameras Earned Councils £37.7 Million by Fining UK Drivers This Year
How to Tell DVLA You Sold Your Car (and Avoid the Buyer’s Fines)
Every New Car Buyer Could Get Bigger Discounts as Britain Misses Its EV Target

What Your Tyre’s Age Actually Means (and When Old Tyres Need Replacing)

Why Drivers Over 70 Pay £480 for Car Insurance While Everyone Else’s Bills Fall
Trending on Motoring Chronicle
Why Drivers Are Ditching Claims Firms to Fight Insurers Themselves

Mile Stones: Why Every EV Driver Will Pay 3p Per Mile From 2028

Why Rural Drivers Will Pay Three Times More Than Londoners Under the New Pay-Per-Mile Car Tax

Why Tyre Pressure Drops Overnight in Winter
