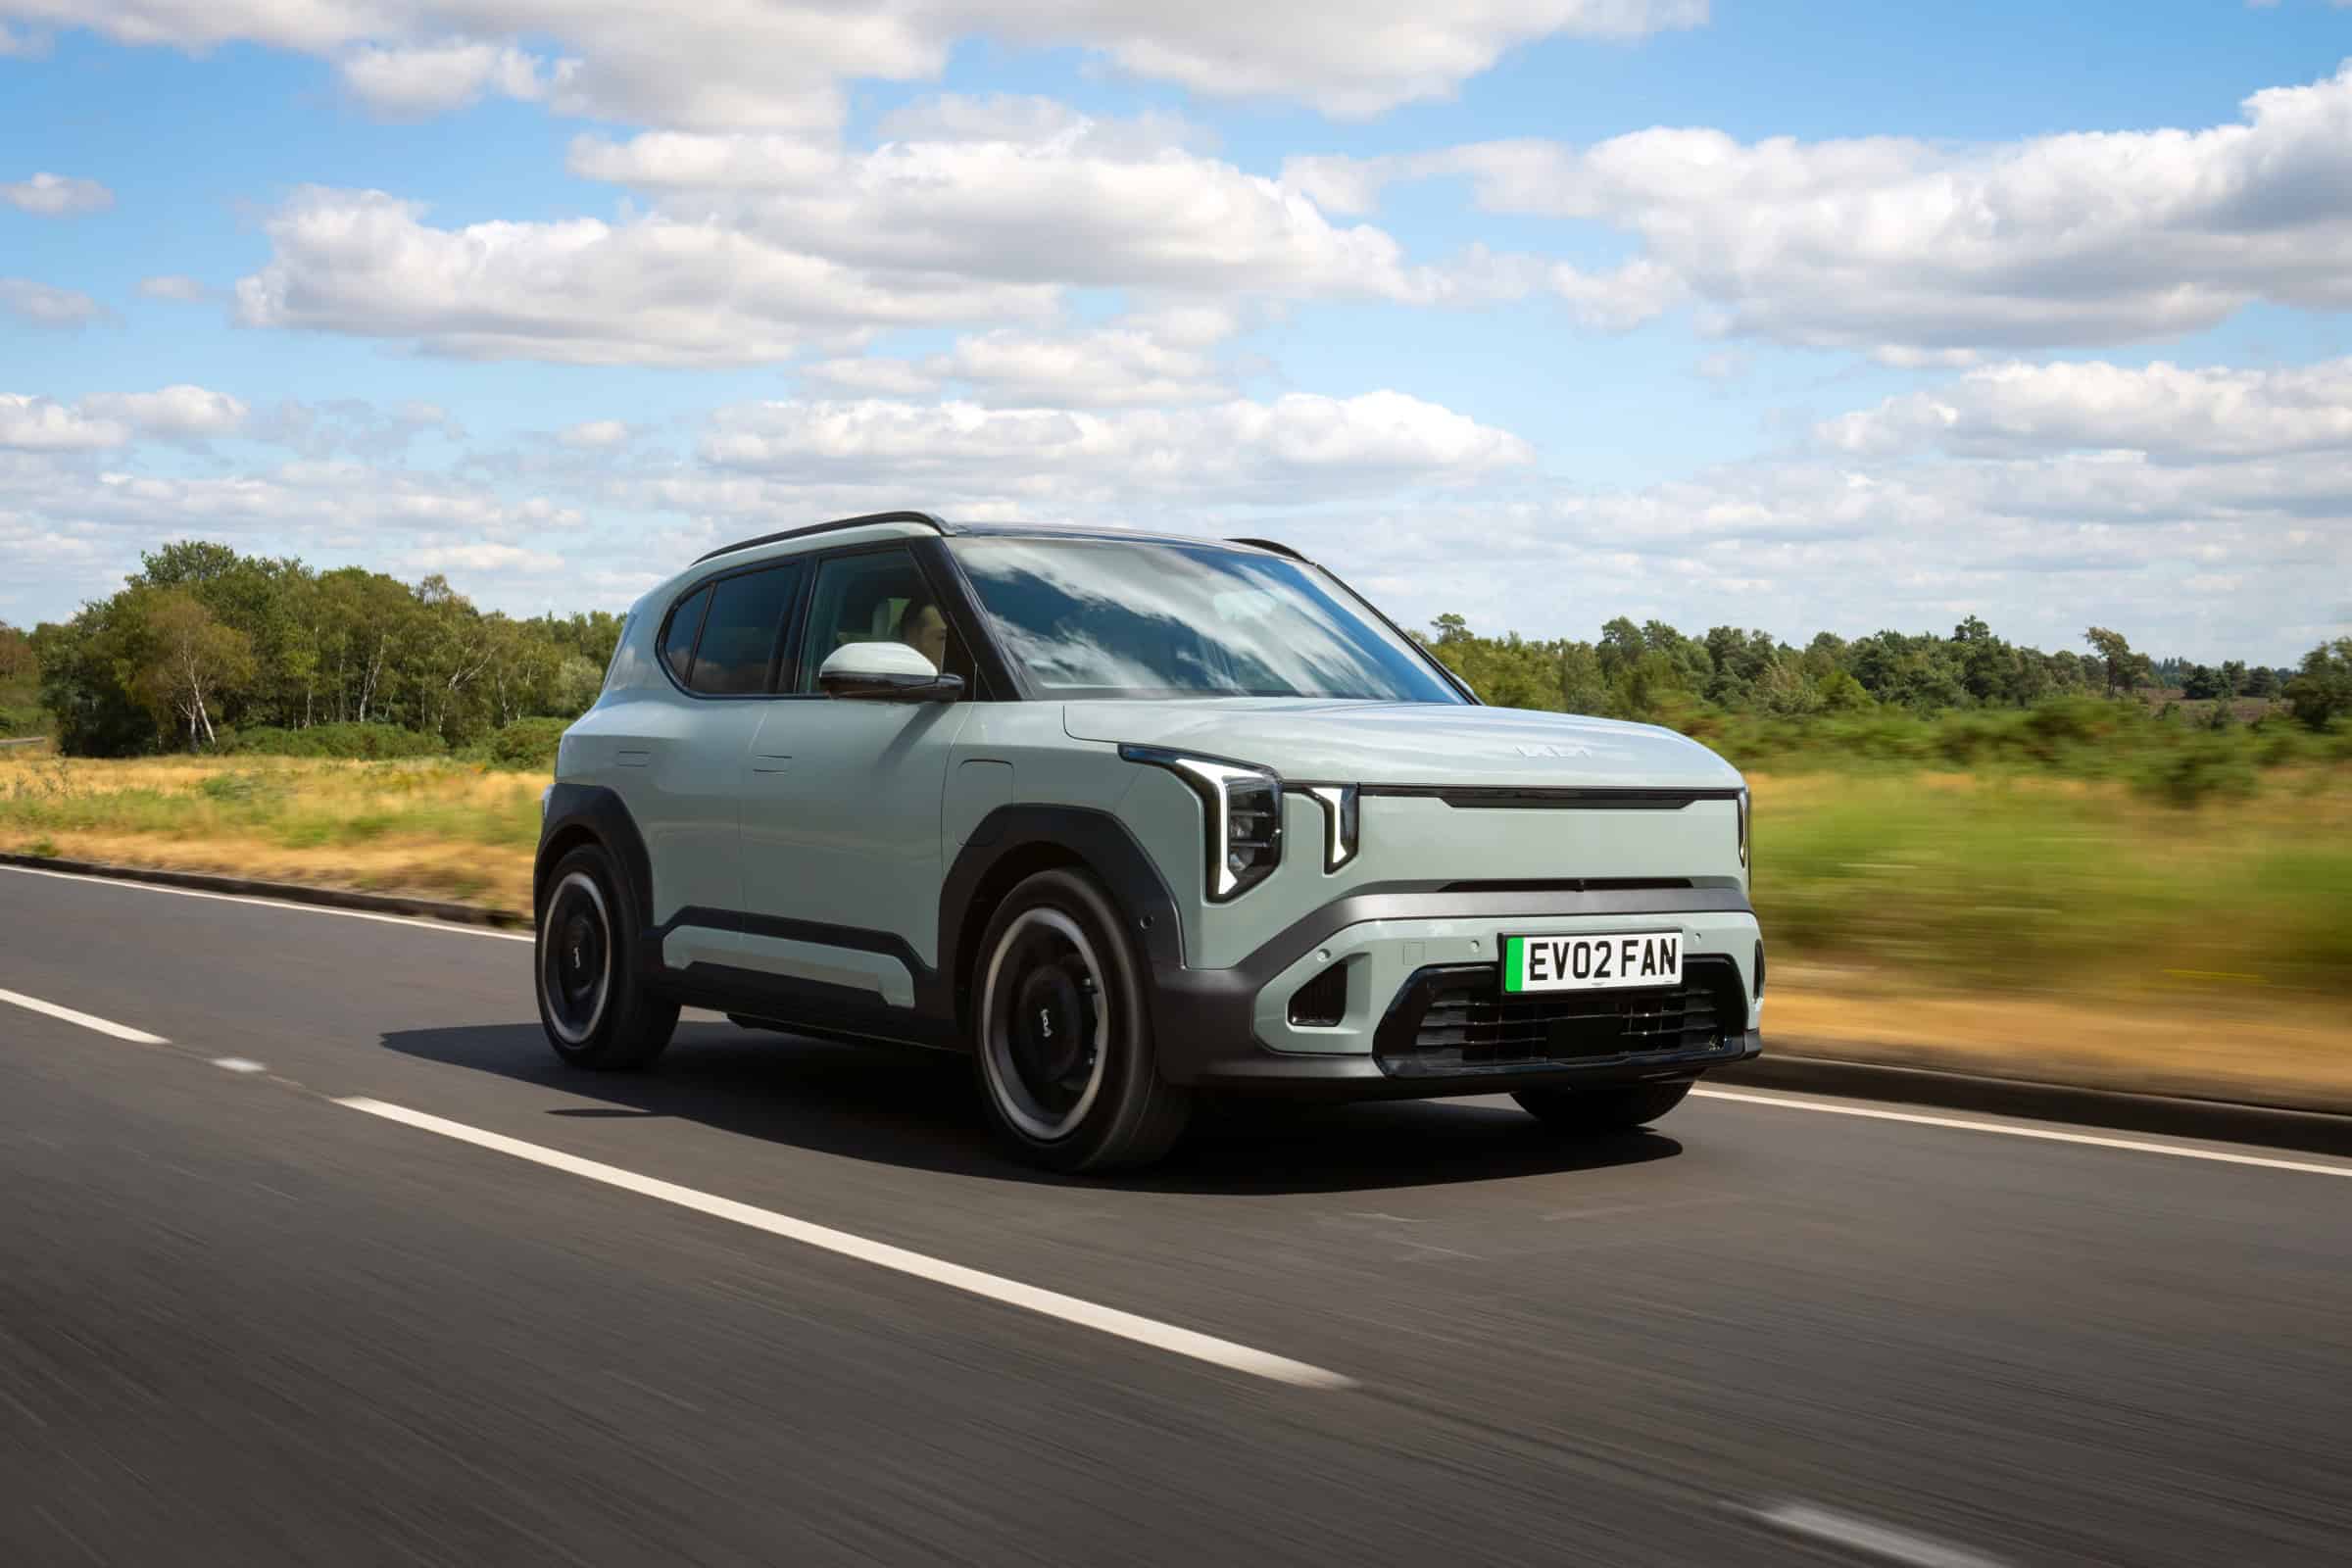
EV Council Says Fuel’s 23.6% Rise Adds $442 a Year to a Small SUV
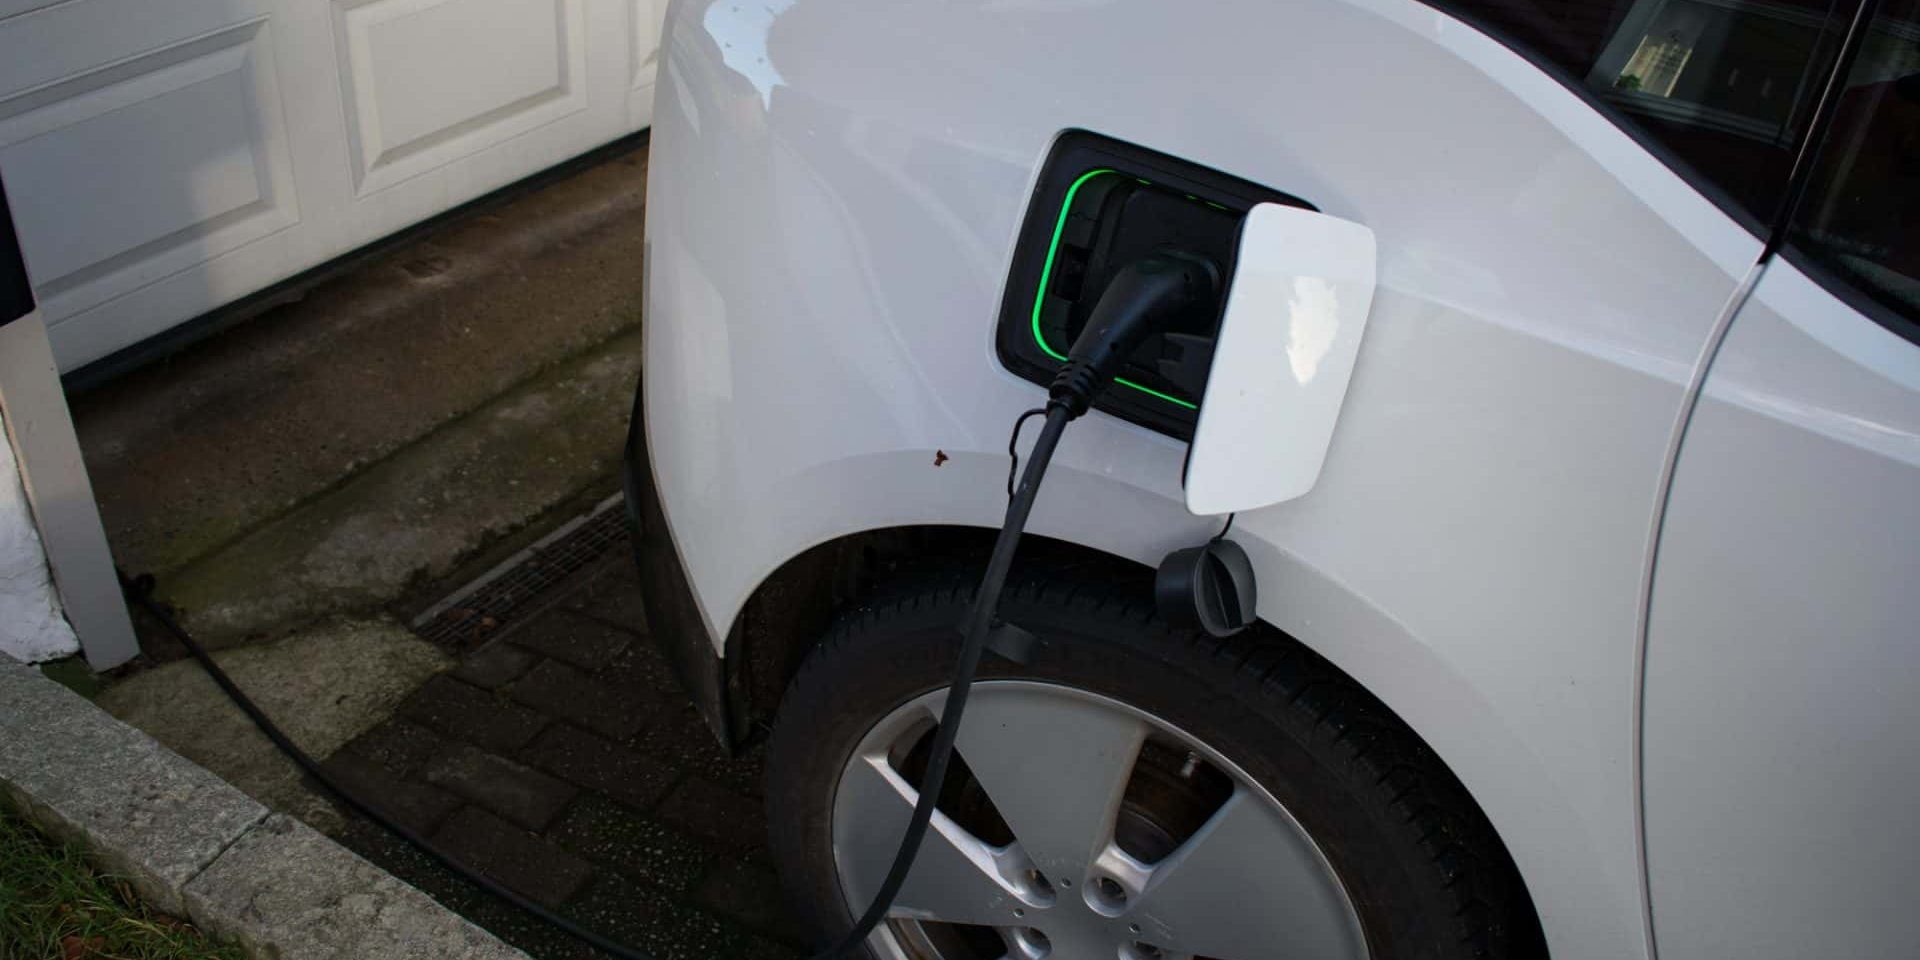

- Automotive fuel rose 23.6 percent in the 12 months to September 2026, and Endgame Analytics calculated for the Electric Vehicle Council that fuel supplied 0.77 percentage points of the 4.3 percent inflation rate.
- The same model puts the extra yearly cost at $442 for a small petrol SUV driven 15,000 km and $48 for an equivalent EV charged mostly at home.
- GoAuto reported the calculation as a what-if commissioned by an EV industry body, and it leaves out purchase prices and freight.
The Bowser Supplied 0.77 Points of a 4.3 Percent Inflation Rate
Automotive fuel prices rose 23.6 percent in the 12 months to September 2026, the Australian Bureau of Statistics (ABS) found. Endgame Analytics, a consultancy working for the Electric Vehicle Council (EVC), calculated that the move added 0.77 percentage points to the 4.3 percent annual inflation rate. The model uses 4.34 percent for the headline rate, so fuel accounts for about 18 percent of it.
For one household, the model prices the change at $442 a year: the extra cost of running a small petrol SUV 15,000 km a year after the 23.6 percent rise. An equivalent EV costs $48 more a year to charge after the electricity rise. The EVC represents the electric vehicle industry, and both figures come from its model.
“Petrol and diesel prices aren’t just hurting motorists at the bowser. They’re adding to inflation across Australia,” said Julie Delvecchio, chief executive of the Electric Vehicle Council.
What the ABS September 2026 Figures Show
The ABS Consumer Price Index (CPI) for September 2026, released on 28 October 2026, shows annual inflation at 4.3 percent, up from 4.0 percent in the 12 months to August. Trimmed mean inflation was 3.6 percent, up from a revised 3.5 percent. In the month of September alone, the CPI rose 0.8 percent in original terms.
Transport rose fastest of the major groups over 12 months, up 8.7 percent, and gained 3.0 percent in the month. Automotive fuel, up 23.6 percent, is the main contributor to the annual rise, and fuel climbed 9.4 percent in September alone on higher world oil prices, the ABS found.
The ABS chart data shows how quickly the group has built. Transport contributed 0.99 percentage points to annual CPI in September 2026, against 0.64 in August 2026 and 0.25 in September 2025. Fuel’s 0.77 points, as Endgame calculated it, is about 78 percent of that September transport contribution.
Capital cities felt it unevenly. The ABS capital city table puts the 12 month rise in the Transport group, which covers more than fuel, at 8.3 percent in Sydney, 8.0 percent in Melbourne and 8.3 percent in Brisbane. Adelaide recorded 10.6 percent, Perth 10.4 percent, Hobart 10.4 percent, Darwin 10.6 percent and Canberra 10.4 percent. Sydney, Melbourne and Brisbane sit at least two points below the other five. Pump prices differ by city too, and the ACCC’s city-by-city figures show the rise in petrol from February was uneven.
Electricity moved too. The ABS reports electricity up 12.8 percent over the year and says the rise is largely the result of the ending of Commonwealth electricity rebates. That figure drives the EV side of the comparison: the $48 is the cost of the 12.8 percent applied to charging.
How the $442 and $48 Are Built
The Endgame model starts with a family in the suburbs running a small petrol SUV for 15,000 km a year. It prices petrol at $1.81 a litre, which it gives as the ABS average for September 2025, so the fuel bill is about $1,870 a year. On our arithmetic that is roughly 1,033 litres, or 6.9 litres per 100 km, at 12.5 cents for every kilometre driven.
Fuel then rose 23.6 percent, which added $442 and lifts the annual bill to $2,312, or 15.4 cents a kilometre. Applied to the $1.81 starting price, the same index move points to about $2.24 a litre. On a 40 litre fill, that is $89.49 against $72.40, or $17.09 more every time the tank is topped up. The $2.24 and the fill figures are arithmetic on the model’s inputs, an illustration and not a pump price.
The EV side assumes charging costs 80 percent less than petrol. The model reaches that by having the owner charge 80 percent of the time at home on an EV tariff of $0.08 a kilowatt hour (kWh) and the remaining 20 percent at public chargers at $0.70 a kWh. On that basis the same 15,000 km costs about $374 a year to power. Electricity then rose 12.8 percent, which added $48 and takes the EV to $422 a year, or 2.8 cents a kilometre.
Before the rise the gap between the petrol SUV and the EV was $1,496 a year ($1,870 less $374). After it the gap is $1,890 ($2,312 less $422). The petrol owner absorbed $394 more than the EV owner, the difference between $442 and $48. The $48 is about a tenth of the $442, as the Council says.
The inflation what-if follows the same logic. Endgame took fuel out of the ABS basket, where it held a 3.27 percent share in September 2025, and costed the electricity to drive the same distance. The steps are minus 0.77 points for fuel, plus 0.08 for the extra electricity and plus 0.10 for rescaling the basket to 100 percent. Annual inflation of 4.34 percent becomes 3.75 percent, 0.59 points lower.
What the Model Leaves Out
The Council and Endgame both call this an illustration. The Council says it does not forecast how fast drivers will switch, and Martin Chow, Director of Endgame Analytics, set the limits of the estimate:
“Our estimate compares the cost of petrol for household driving with the cost of the electricity needed to cover the same distance in an EV. It assumes charging costs 80% less than petrol, and excludes vehicle purchase prices and indirect effects, such as freight.”
The charging assumption carries most of the result, and it suits a household with a driveway or garage. Our arithmetic on the model’s implied numbers shows why. The $374 equates to about 1,833 kWh a year, or roughly 12.2 kWh per 100 km. The 20 percent of that energy bought at public chargers costs about $257, and the 80 percent bought at home costs about $117, so public charging produces roughly 69 percent of the bill from a fifth of the energy.
A household that cannot charge at home faces a different bill. Charging all 1,833 kWh at $0.70 would cost about $1,283 a year before the electricity rise and about $1,447 after the 12.8 percent, still below the $2,312 petrol figure, though the saving shrinks from $1,890 to $865. A household charging everything at home at $0.08 would pay about $147, or $166 after the rise. Apartment residents and renters without off-street parking can depend more on the dearer public chargers, and home tariffs vary considerably.
The Council cites Australia’s cheapest new EV at $19,990 driveaway. That is a limited-time promotional price on the BYD Atto 1 Essential, which lists at $23,990, so the regular price is higher. For what that model costs to own each month in two states, the BYD Atto 1 monthly costs put loan, servicing, registration, insurance and energy side by side.
The Council’s own analysis puts the average fall in base-model list prices of Australia’s ten best-selling EVs at 3.1 percent in the year to September, and it counts more than 500,000 battery electric vehicles in use. Purchase price, finance, insurance, servicing and resale value all sit outside this calculation.
The ABS keeps the CPI basket shares fixed until its January 2027 update, so a switch to EVs would not move the published index soon. The 0.59 point gap exists only in the model.
What the Council Wants From Government
Julie Delvecchio, the Council’s chief executive, drew the policy conclusion from the numbers:
“Electric vehicles give Australians a way to break that direct link with global oil prices. The more of our transport we electrify, the less exposed we become to future fuel price shocks and inflation.”
She tied it to household budgets:
“Inflation is squeezing household budgets, and every rate rise adds to that pressure,” Ms Delvecchio said. “The more Australians who drive electric, the less exposed households and the wider economy are to oil price shocks.”
She then named three levers:
“Getting more Australians into EVs faster is good economic policy. That means keeping the New Vehicle Efficiency Standard strong, maintaining the FBT exemption and building more chargers.”
The New Vehicle Efficiency Standard (NVES) is the federal law, passed in 2024, on the fuel efficiency of new vehicles. The FBT exemption is the fringe benefits tax concession for EVs. The third ask, more chargers, links back to the model: every household that depends on public charging pays the $0.70 a kWh rate in the Council’s assumptions, which is 8.75 times the $0.08 home tariff.
The ABS inputs, fuel up 23.6 percent, electricity up 12.8 percent and headline inflation of 4.3 percent, are published figures any reader can check. The 80 percent saving and the $0.08 and $0.70 prices come from the Endgame ownership cost model, so those are the inputs to test.
What It Means for Your Budget and What Comes Next
Your own fuel bill is the number that counts, and it takes three inputs. Multiply your annual kilometres by your car’s litres per 100 km, divide by 100, then multiply by what you pay a litre. The model’s small SUV burns about 1,033 litres over 15,000 km. Apply the 23.6 percent index rise to a bill from a year ago to see the increase at the same usage: a household that spent $2,000 on petrol a year earlier now faces about $472 more, or roughly $9 a week.
Comparing against an EV takes two more inputs. Find your electricity price per kWh on your latest bill, and ask your retailer whether an EV or off-peak tariff exists in your state. Then check where you would charge. The model’s 80 percent saving needs a home tariff near $0.08 a kWh and most charging done at home, and it falls fast as the public share grows. Where you fill the tank counts as well: NRMA figures for 13 November showed the gap between cheapest and dearest servo inside Sydney, Melbourne and Brisbane far wider than the gap between the cities’ averages.
The next data point lands on 25 November 2026, when the ABS publishes the CPI for October 2026. It will show whether the 9.4 percent monthly surge in fuel held, eased or reversed, and whether annual inflation stays at 4.3 percent. November’s figures follow on 6 January 2027. From February 2027 the ABS publishes the monthly CPI on the fourth Wednesday of each month, and the basket shares update with the January 2027 CPI, scheduled for release on 24 February 2027.
Until then, the $442 and $48 are what the year did to two modelled cars on the Council’s assumptions. Test those assumptions against your own driveway, tariff and kilometres before acting on them.
Want more car content? Add us as a preferred source on Google to your favourites list for the best automotive news and analysis on the internet.
If you enjoyed this article, be sure to follow us on Microsoft Start.
Reviewed by Preetam Gadekar

Leave a Comment
More in News

Woman orders windshield from Safelite. They can’t recalibrate it. Then she’s charged $400 for a third try—and that’s just the beginning

Connecticut Mobile ID Launches Nov. 18, Free, and TSA Accepts It

Acura Widens ZDX Brake Recall to 14,648 EVs With a Free Software Fix

Toyota Camry driver goes in for oil change. Then she sees the note the mechanic left on the sticker: ‘I think my mechanic is obsessed with me’
Public EV Charging Costs 42 Cents a kWh, 32 in Kansas and 55 in Hawaii
Trending on Motoring Chronicle
Insurers Are Writing Off Thousands of Repairable Electric Cars

London Tunnel Drivers Face Toll Hikes From September as TfL Raises Blackwall and Silvertown Prices

A decade of vision: the 10 most iconic Genesis concept cars
New High Performance Hybrid Continental GT, GTC and Flying Spur – the daily supercar family expands [Photo Gallery]