Average New Car Price Hits Record $51,109, Up 2.1% on October 2025

- American buyers paid a record $51,109 on average for a new vehicle in October, a $649 jump on September, Kelley Blue Book data shows.
- Incentives averaged $3,490 a vehicle, or 6.8% of the average price, which is $252 more than in October 2025.
- Vehicles priced from roughly $28,000 to $38,000 gained 9.6% in sales volume from a year earlier, so buyers are still finding cars well under the headline number.
Why a Record Average Price Hides a Cheaper Market
Shoppers who bought a new vehicle in October paid an average of $51,109, the highest monthly figure Kelley Blue Book has recorded. That average transaction price, or ATP, rose $649, or 1.3%, from September’s revised $50,460 and finished 2.1% above October 2025.
The yearly gain is slower than normal. The longer-run average for October is 3.6%. The average sticker price, the manufacturer’s suggested retail price, reached $52,933, up 1.4% on September and 2.4% on a year ago, while the industry usually posts a 3.3% yearly rise in sticker prices. Both measures ran under their long-term pace, so the record owes as much to what buyers chose as to what automakers charged. Kelley Blue Book credits a mix of price inflation and heavy sales of expensive midsize SUVs, full-size SUVs and full-size pickup trucks.
That mix is the key to reading the number. One average covers everything from a compact car averaging $28,030 to a Cybertruck averaging $92,380. A buyer whose shortlist sits in the middle of the market can land well below $51,109 or well above it, and the record says little about the price of the specific car on your list.
What the Average Includes and Leaves Out
Kelley Blue Book calculates its ATP before incentives, taxes and fees. That makes it a headline average and a poor guide to the out-the-door bill, so no buyer should expect to pay exactly $51,109 at the signing table. Rebates and special offers pull the bill down; sales tax, registration and dealer fees push it up, and those vary by state and dealership.
Incentives are the part of that gap the data does measure. The October average equaled 6.8% of the ATP, against 6.7% the month before and 6.5% a year ago. In dollars the estimated average incentive was $3,490, which is roughly $130 more than in September and $252 more than a year earlier. Subtracting $3,490 from $51,109 leaves $47,619, a rough guide to the average price after incentives and before taxes and fees.
Incentive spending is still below its long-term averages. Kelley Blue Book’s read is that automakers and dealers are not pursuing sales or inventory reduction aggressively, even with prices at a record. For a shopper, that means a discount will not arrive on its own: ask which rebates, bonus cash and financing offers apply to the exact vehicle, and ask for the figure in writing.
The Segments That Set the Price
October sales grew close to 10% from a year earlier, and the midsize SUV took the top spot, moving ahead of compact SUVs, which led in September. The five highest-volume segments accounted for 64.4% of all vehicle sales. Here are the ATPs and yearly changes. The midsize SUV averaged $50,570, up 1.9%. The compact SUV averaged $37,895, up 4.3%, the fastest rise of the five. The full-size pickup truck averaged $67,912, up 1.4%. The subcompact SUV averaged $31,333, up 1.9%. The compact car averaged $28,030, up 3.4%.
Only the pickup sits above the industry average. The midsize SUV is $539 under it, and the other three are far under it. A full-size pickup costs $39,882 more than a compact car on these averages, and that spread lifts the headline.
Erin Keating of Cox Automotive put the split this way: “The average is telling us as much about product mix as it is about affordability. Three of the five highest-volume segments transacted significantly below the industry’s average, while vehicles priced from roughly $28,000 to $38,000 collectively gained 9.6% in volume year over year. Consumers are still buying plenty of vehicles well below the headline average transaction price, even as strong demand for full-size pickups and other larger, luxury, well-equipped vehicles keeps pushing the average to new highs.”
Used cars offer a different comparison point. Wholesale prices for three-year-old vehicles in the Manheim index fell 2.8% in October, less than the typical 3.1% drop for the period. Used buyers face high prices too: the average used car price topped $30,000 earlier this year for the first time in about three years.
Electric Vehicles and Tesla
The average new EV sold for $56,220 in October, up 1% from September and 2.7% lower than a year earlier. That is $5,111 above the all-vehicle average. EV buyers also get the largest incentives: the average EV incentive equaled 11.3% of the ATP, up from a revised 11.2% in September and 1 percentage point above the 10.3% of a year ago. On a $56,220 price, 11.3% works out to roughly $6,350, against the $3,490 industry average.
Tesla’s October ATP was $54,194. That is lower than in September and 1.2% higher than in October 2025. Cybertruck sales helped lift the yearly figure: Cox Automotive estimates 1,914 were sold in October, the strongest month in more than a year, at an average price of $92,380.
What $51,109 Costs at 11.46%
Most buyers finance, and the loan costs more than the sticker suggests. Cox Automotive’s Dealertrack Credit Availability Index, written by Scott Vanner, a Cox Automotive manager, put the average contract rate at 11.46% in October. That is up 24 basis points on September and the highest of any month from April through October. The same report has the 5-year Treasury yield at 4.93%, a level last reached in June 2007. Contract rates rose more than the Treasury yield in October, which Cox says could mean they are catching up with it.
The 11.46% covers every loan in the index, new and used, across all channels and lender types, so it is an all-loan average and a new-car buyer with strong credit or a manufacturer’s promotional rate will pay less. Use it as an illustration of what an average-priced vehicle costs when rates run this high. Financing the full $51,109 at 11.46% over 60 months comes to about $1,123 a month and $16,271 in interest, a total of $67,380. Stretching the same loan to 72 months drops the payment to about $985 but lifts the interest to $19,804. A down payment of 13.0%, the average Cox recorded in October, is $6,644 and trims the 60-month payment to about $977, with $14,155 in interest. These figures leave out taxes, fees and incentives. For a deeper look at what borrowers pay, see interest on a typical new car loan.
The price band changes the math. Over the same 60 months at 11.46%, a $37,895 compact SUV costs about $833 a month, which is $290 less than the average-priced vehicle. A $28,030 compact car costs about $616 a month, $507 less. The 9.6% volume gain for $28,000 to $38,000 vehicles is easier to understand with those payments beside it.
Loan structure has its own risks. Cox found that 31.1% of loans in October ran longer than 72 months, a drop of 0.7 percentage points from the record set in September, though the share has held at 31% or higher for five months running, and that 58.7% of loans financed more than the vehicle was worth, the highest of any month from April through October and 490 basis points above a year ago. Long terms and a financed shortfall let a buyer squeeze a purchase into the monthly budget up front, yet they bring higher total borrowing costs and less room to sell or trade the vehicle later. The subprime share of loans rose to 17.9%, and the overall approval rate rose to 73.9%.
Steps to Take Before You Sign
Ask the dealer for an out-the-door price in writing, with the vehicle price, every incentive, taxes, registration and each fee on separate lines. The $51,109 average leaves those items out, so comparing a quote with it only works line by line.
Line up a loan before you shop. Credit unions posted their best credit access reading in the Cox index in four years, a level last seen in October 2022, and a pre-approval from one gives you a rate to measure the dealer’s offer against. Compare the annual percentage rate and the total of payments, not the monthly figure alone.
Keep the term at 60 months or shorter if the payment allows. A 72-month loan on an average-priced car adds $3,533 in interest to the 60-month cost at 11.46%, and the longer the loan runs, the more likely you owe more than the car is worth. If you are trading in a vehicle with a loan balance larger than its value, ask for the payoff figure and the trade-in offer on paper, so you can see how much negative equity the new loan would absorb.
Shop the band where the buyers are going. Vehicles priced from roughly $28,000 to $38,000 are the part of the market gaining volume, and the segment averages above give you a benchmark: compact SUV at $37,895, subcompact SUV at $31,333, compact car at $28,030. Before paying for a used car instead, the checks before handing over money apply the same way.
Want more car content? Add us as a preferred source on Google to your favourites list for the best automotive news and analysis on the internet.
If you enjoyed this article, be sure to follow us on Microsoft Start.
Sources
- Kelley Blue Book: Kelley Blue Book Report: Average New-Vehicle Prices Top $51,000, Reach Record High in October
- Cox Automotive: Auto Credit Access Edges Up for Sixth Straight Month as Subprime Share and Negative Equity Climb
- Cox Automotive: Manheim Used Vehicle Value Index: October 2026 Trends
Reviewed by Preetam Gadekar

Leave a Comment
More in News
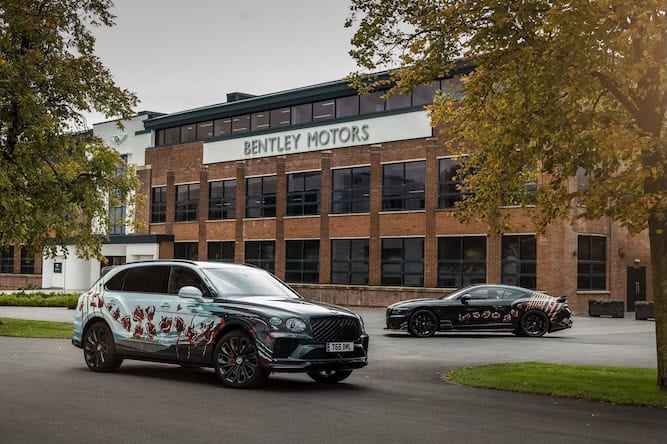
Bentley unveils 2026 Remembrance cars: A symbol of Remembrance and belonging [Photo Gallery]

California man considers buying new Toyota. Then he realizes he won’t be able to leave the state

Pennsylvania Raises School Bus Passing Fines to as Much as $500 in 2027

Honda Recalls 635,808 Pilots, MDXs and TLXs That Can Lose Power Steering

Colorado Voids 15,870 I-25 Work Zone Camera Tickets Worth $1.1 Million
Trending on Motoring Chronicle

Why Dashcam Footage Could Decide Your Insurance Claim (and How to Submit It)

Subaru and Operation Warm expand support for children in urgent need as homelessness rises

Oklahoma Has the Least Reliable EV Chargers in the US, New Report Finds
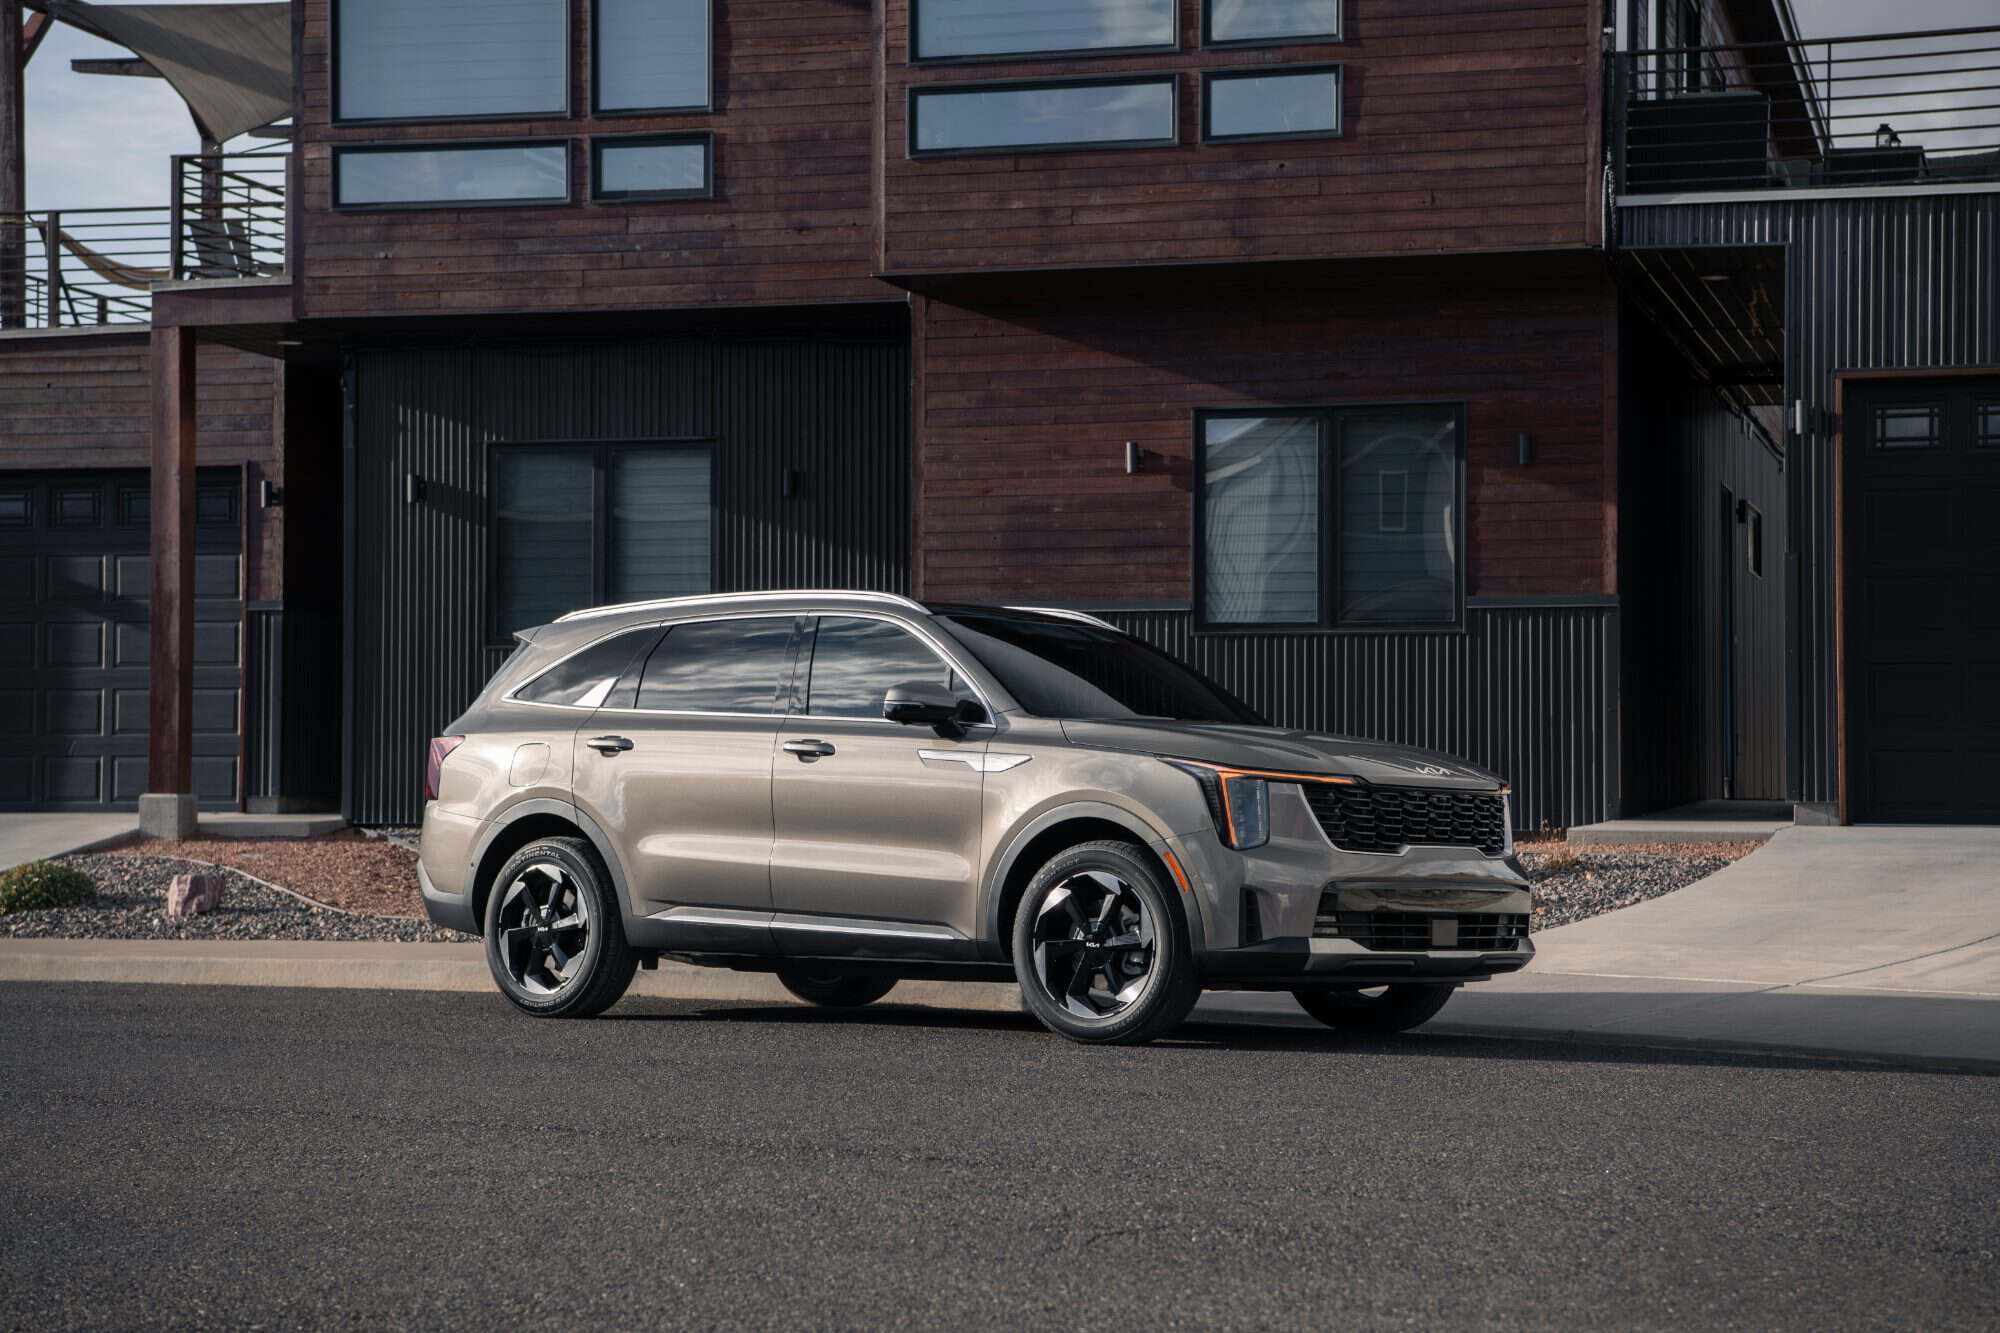
Kia Prices 2027 Sorento PHEV from $53,890 with Simplified Trim Lineup