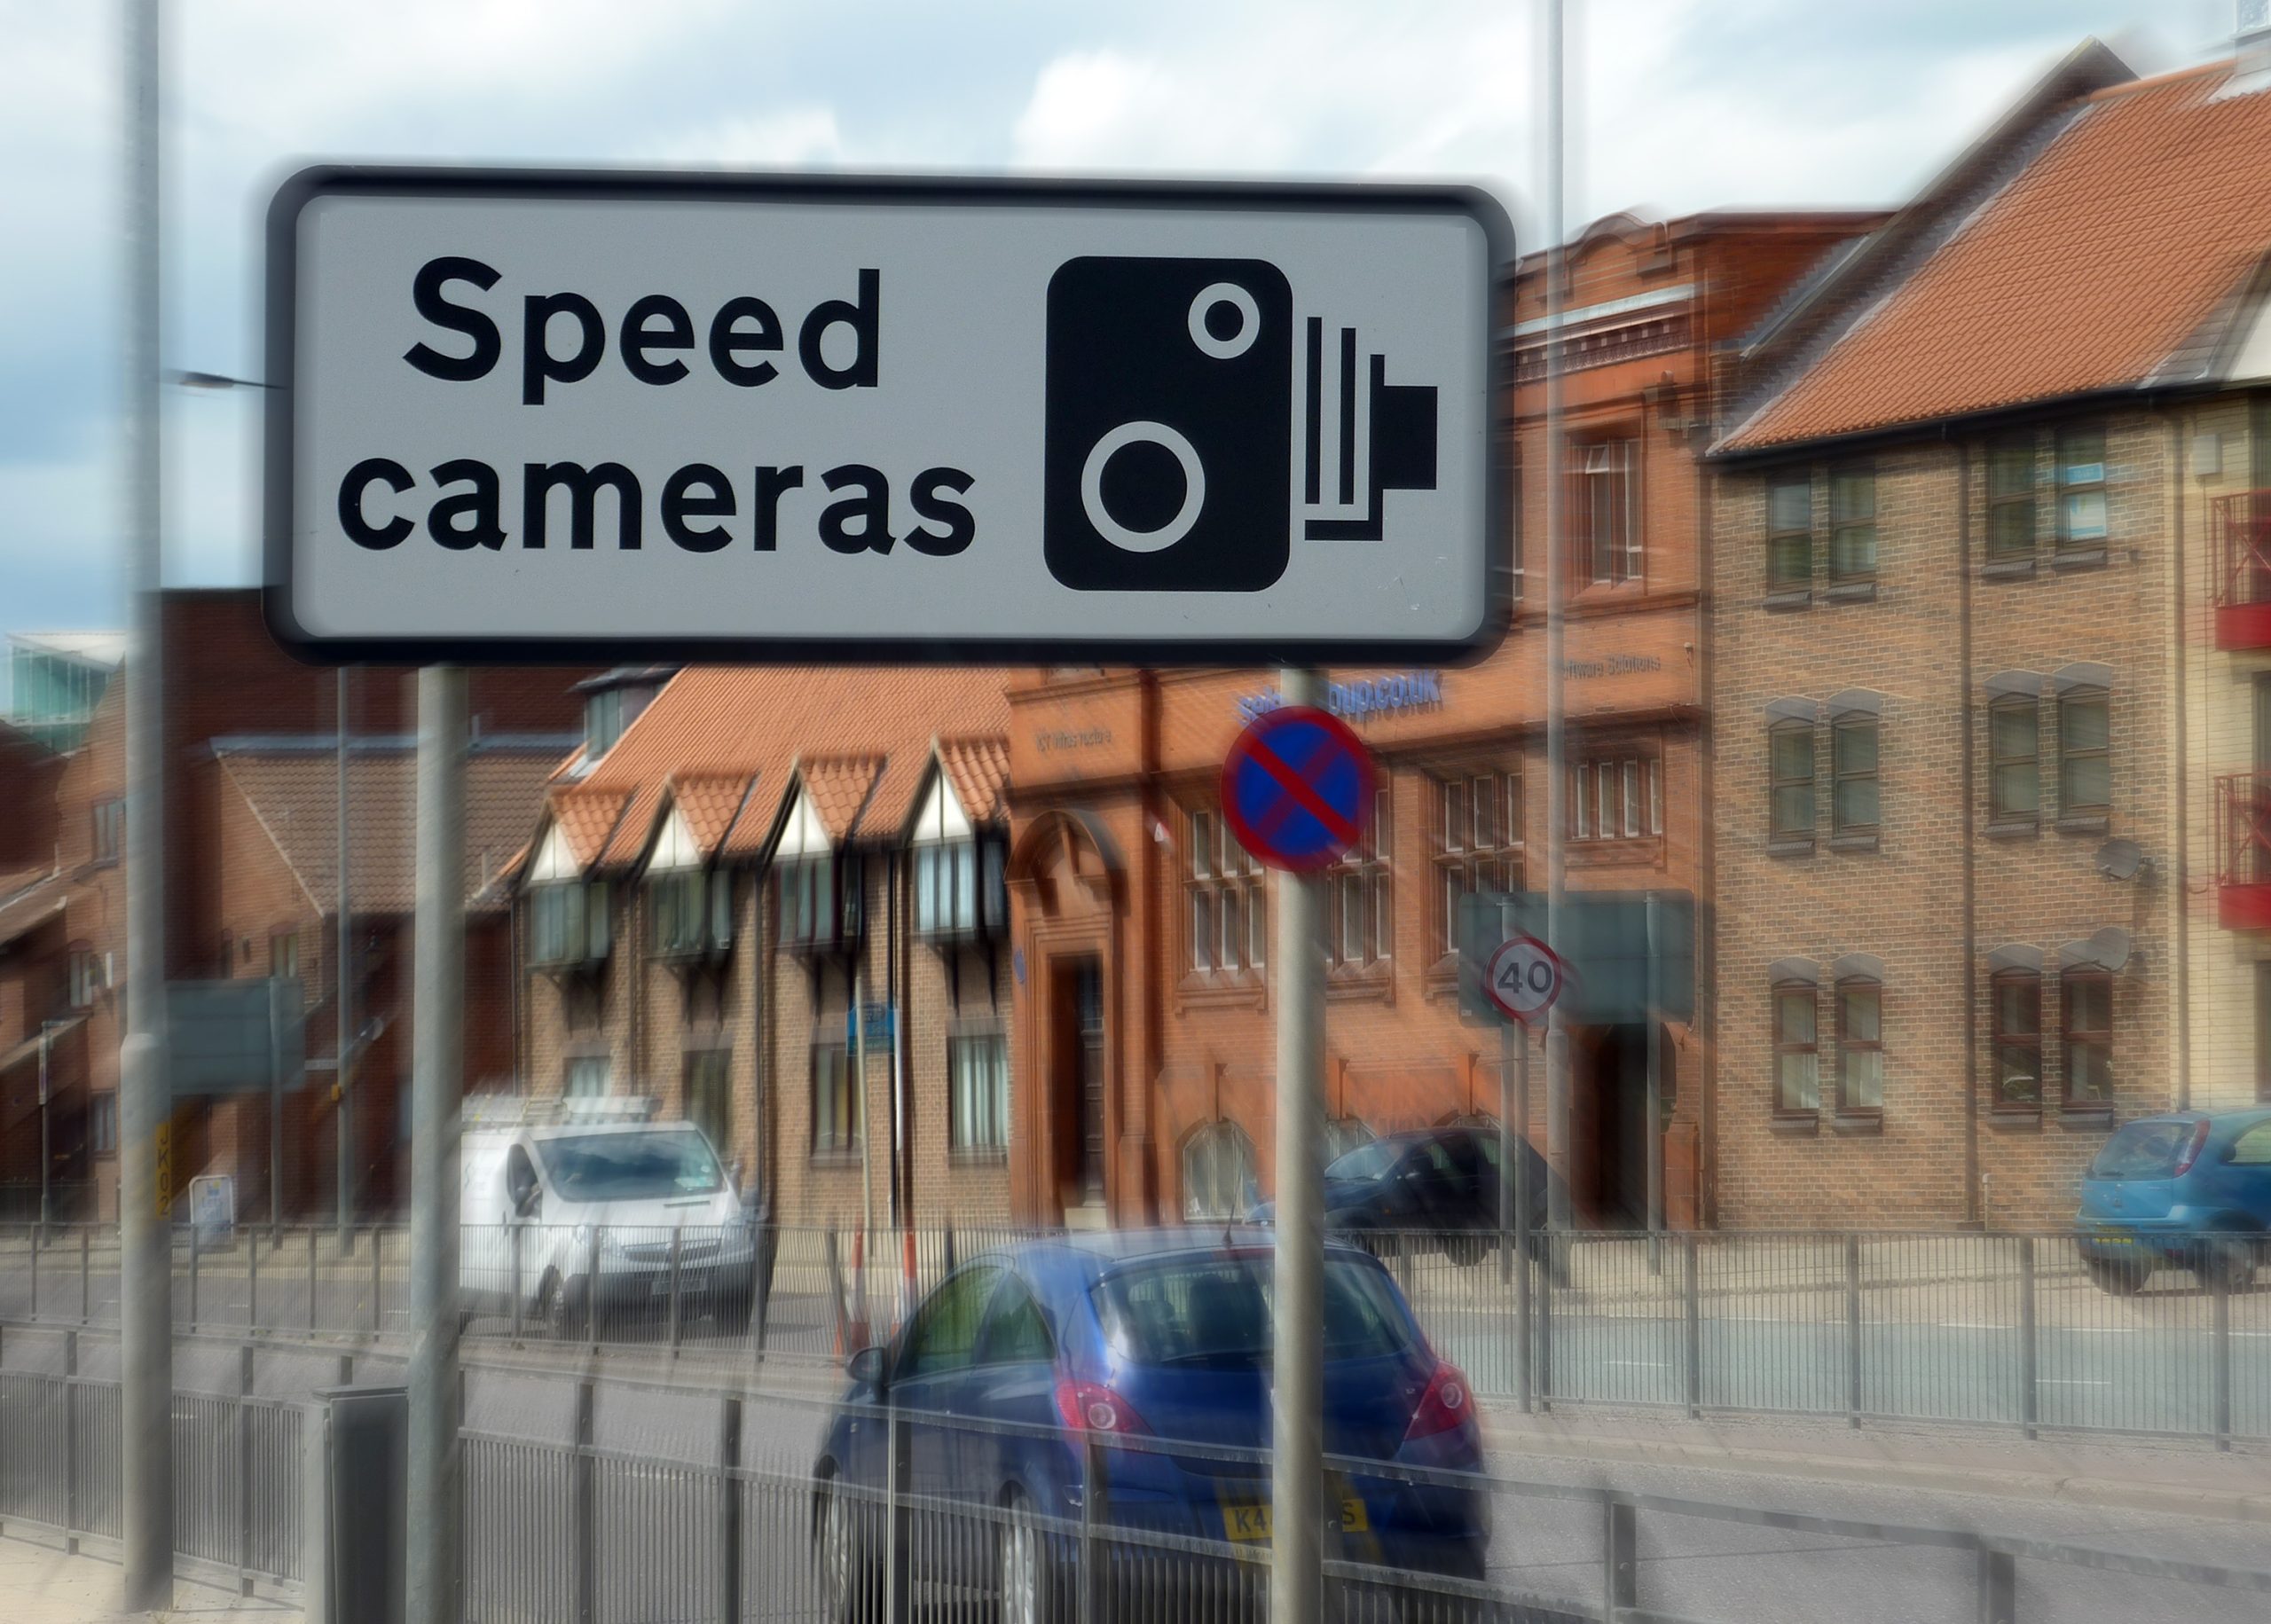
Why Car Theft Risk Now Depends on Your Postcode, ONS Data Reveals

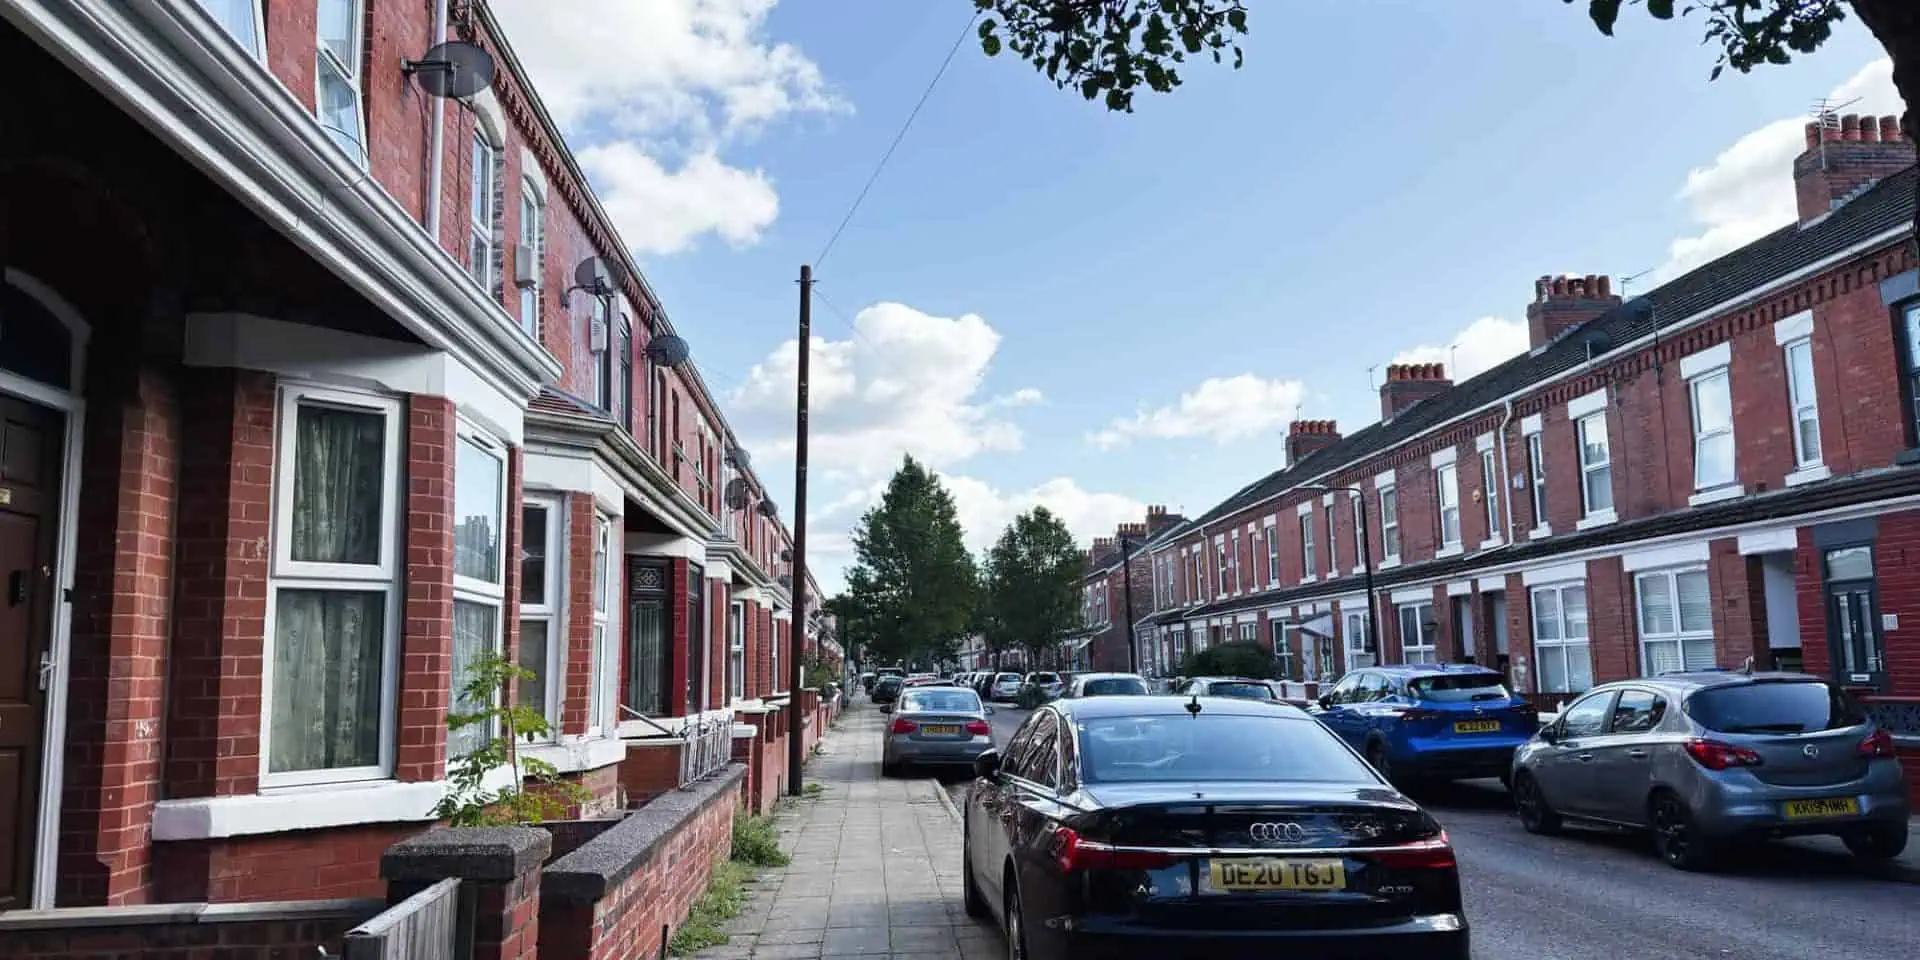
- ONS figures show vehicle crime fell 11 percent to 312,250 offences in the year to March 2026, but the risk is wildly uneven across the country.
- Kensington and Chelsea, Haringey and Newham have the highest vehicle crime rates in England and Wales, while the City of London is the safest area by a wide margin.
- A free postcode check, a Thatcham security rating and a simple change to how you park can cut your own risk regardless of where you live.
Your postcode now does more to decide your car’s risk than the car itself
Official crime figures published by the Office for National Statistics show police recorded 312,250 vehicle offences in England and Wales in the year to March 2026, down 11 percent on the year before. Reported figures for the 2026 calendar year so far show a similar pattern, with 287,068 vehicle crime reports logged, a drop of 10 percent on the 318,996 recorded in 2025. Nationally, that gives an average rate of 4.30 vehicle crimes per 1,000 people.
That average hides a gap wide enough to change how worried you should actually be. Kensington and Chelsea tops the table with a rate of 11.82 vehicle crimes per 1,000 daytime population, followed by Haringey at 10.85 and Newham at 10.65. At the other end sits the City of London, where the rate drops to just 0.38, roughly thirty times lower. A car parked outside a flat in Newham sits in a different risk category to the same car parked in a village in Rutland, and no amount of generic advice about “locking your doors” changes that gap.
Why the national total falling does not mean your street is safer
An 11 percent national fall sounds like good news, and in aggregate it is. But crime statisticians have repeatedly warned that national vehicle theft figures smooth over sharp local spikes. A borough can see car crime climb two years running while the national number falls, simply because theft is concentrating into fewer, more targeted areas rather than spreading evenly. Inner London boroughs with dense on-street parking, high footfall and fast routes to motorways consistently post the worst numbers, while rural and semi-rural authorities with off-street parking and lower population density post the best.
Vehicle type still matters inside that geography. Keyless entry models remain the preferred target for organised theft gangs using relay devices that amplify a key fob’s signal from inside a house to unlock and start a car parked on the drive outside. A relay kit capable of defeating an unprotected keyless system can be bought online for under fifty pounds, while a signal-blocking Faraday pouch for the fob costs around six. The arithmetic of that gap, combined with a high local crime rate, is what turns a single street in Newham into a far riskier place to leave a car overnight than a street with an identical car thirty miles away.
How to check your own risk in under two minutes
Every force in England and Wales publishes street-level crime data through police.uk, where entering a postcode returns a breakdown of recorded crime types for that specific street over the past year, vehicle crime included. It takes under two minutes and gives a far more useful answer than any national average. Insurers increasingly price using the same kind of granular data, which is part of why two drivers with identical cars and identical driving records can be quoted very different premiums depending on which side of a borough boundary they live on.
The vehicle itself still carries its own risk profile independent of location. Thatcham Research now publishes a security rating for every new model sold in the UK, grading keyless systems from “superior” down to “unacceptable” based on how easily they fall to a relay attack. Six of the eleven new models launched this year were rated “poor” specifically because their standard keyless system has no defence against signal amplification, while models fitted with motion-sensing fobs that go to sleep after a short period of inactivity kept the top rating. Buyers in a high-risk postcode checking a car’s Thatcham rating before they sign are making a decision that materially changes their odds, not just a box-ticking exercise.
What insurers already know that most drivers do not
Insurers have quietly been pricing on street-level risk for years, long before this latest ONS breakdown made the geography so explicit. A standard motor insurance quote already factors in the applicant’s postcode alongside age, claims history and the car itself, which is why two neighbours on the same road with similar cars can still see a gap in premium if one sits a few streets closer to a recorded theft hotspot. What this new data adds is a way for drivers to see roughly where their own postcode sits on that scale themselves, rather than taking an insurer’s internal risk model on trust. A driver who moves from a flat in a high-risk inner London borough to a house with a driveway in a lower-risk area is not just buying somewhere to park. They are changing a number an insurer has already quietly priced them against for every renewal to come.
That pricing reality also explains why some drivers report being quoted sharply higher premiums despite having no claims and no convictions of their own. A clean driving record does not override a postcode sitting inside a recognised theft cluster. Shopping around at renewal rather than accepting an automatic rollover remains the single most effective way to test whether a particular insurer has priced a specific street more harshly than its rivals, since risk models differ between providers even when they are drawing on broadly similar crime data.
What actually reduces the odds, street by street
Police forces in the highest-risk boroughs consistently point to the same small set of measures. Parking off-street, even on a shared driveway rather than directly on the kerb, removes a car from the easiest category of target. A steering lock remains a visible deterrent that a relay attack alone cannot bypass, since the thief still has to deal with a physical barrier once the car unlocks. Storing key fobs away from front doors and hallways, ideally in a signal-blocking pouch or box, closes off the relay attack at its source rather than relying on the car’s own electronics. A tracked vehicle changes the outcome even after a theft has happened: police data shows forces recover the large majority of tracker-fitted stolen cars, compared with a national recovery rate for all stolen vehicles that remains far lower.
None of these measures cost anywhere near what a stolen car costs, in money or in the weeks lost dealing with an insurance claim and a police crime reference number. For drivers in the highest-risk boroughs identified in this latest data, treating vehicle security as a one-off decision made at the point of purchase misses the point. The risk is set by the postcode as much as the car, and only the postcode check tells you which one you are actually dealing with.
Sources:
- https://www.ons.gov.uk/peoplepopulationandcommunity/crimeandjustice/bulletins/crimeinenglandandwales/yearendingmarch2026
- https://crimerate.co.uk/vehicle-crime
- https://news.thatcham.org/keyless-vulnerability-sees-more-otherwise-secure-new-cars-downrated/?lang=eng
- https://www.police.uk/

Leave a Comment
More in News

GEM Warns Drivers to Give Pedestrians and Horse Riders Extra Space This Weekend

How Often Should You Rotate Your Tyres (and What Skipping It Costs You)

How DVSA Found Nearly 3 Million Cars Passed an MOT They Should Have Failed

2027 Subaru Outback Starts at $32,995 as Entry Price Drops $2,000
What Every EV Driver Now Pays at a Public Charger Beats the Cost of Diesel
Trending on Motoring Chronicle

What a Coolant Warning Light Means Before It Costs You a £1,000 Repair

What a Car Pulling to One Side When Braking Actually Means for Your Safety
Ford Recalls 11,405 Rangers After Fake Parts Knock Out the Backup Camera

Two in Five Drivers Now Switch Off Their Car’s Built-In Safety Systems