The Faults That Fail the Most MOTs in Britain, and the Checks That Prevent Them


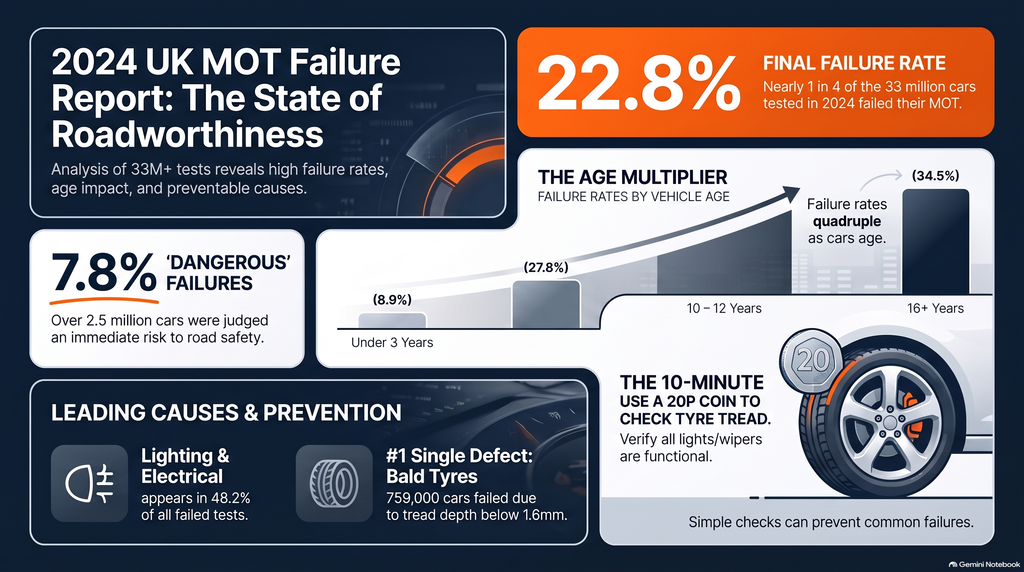
Of the 33,061,250 car MOTs carried out in 2024, 22.8 per cent failed, and the defects behind those failures are dominated by wear items rather than anything to do with the engine or the gearbox. Lighting faults turn up in nearly half of all failed tests. The single most common defect on the entire list is one a driver could find on the driveway in a minute, using a coin from the door pocket.
Key takeaways:
- 22.8 per cent of cars failed their MOT in 2024, from our analysis of DVSA’s own test data.
- Age changes the odds completely: 8.9 per cent of cars under three years old fail, against 34.5 per cent of cars aged 16 or more.
- Most failures come from faults an owner could have found before the test, with no tools and no ramp.
How Many Cars Actually Fail, and What That Number Means
These figures come from our own analysis of DVSA’s anonymised MOT data for 2024, covering 33,061,250 class 4 tests. Class 4 is the category most cars sit in. Retests are excluded, so every test counted here is a car arriving for its annual check.
Our numbers reconcile with DVSA’s published statistics to within 0.01 percentage points on the failure rate. The small difference in test counts, about 0.15 per cent, comes from DVSA reporting classes 3 and 4 together, where we have isolated cars.
The Headline Rate
Of those 33 million tests, 23,712,018 passed outright and 7,537,781 failed. That is a final failure rate of 22.80 per cent, or close to one car in four leaving with a fail certificate.
A second figure exists alongside it, which is where confusion between sources begins. The initial failure rate, which counts every car that arrived with a defect serious enough to fail, is 28.28 per cent. The gap between the two is made up of cars put right at the test station before the result was issued.
Both figures are correct, and they answer different questions. The initial rate describes how many cars turned up in an unroadworthy state. The final rate describes how many went home needing repairs and a retest, which is the one most drivers are asking about.
Pass, Fail, and the Middle Ground
Pass after rectification sits between the two. The tester finds a defect, the fault is put right in the bay, and the certificate records a pass. In 2024 that happened on 1,811,451 tests, 5.48 per cent of the total.
A bulb is the classic case. A lamp missing or not working accounts for 575,748 failed tests on its own, with a further 256,026 tests where the same fault was fixed on the spot and the car passed. The difference between those two outcomes is often no more than whether the station had the bulb on the shelf and five minutes spare.
No garage is obliged to fix anything in the bay. A busy station with a full diary records the defect and fails the car, which turns a two pound part into a retest and another trip across town.
Major and Dangerous
Defects fall into three categories. Minor faults and advisories are recorded and the car still passes. A major defect fails the car. A dangerous defect fails it with an instruction attached: the car should not be driven until the fault has been repaired.
Major items appeared on 25.31 per cent of tests. Dangerous items appeared on 2,587,268 tests, 7.83 per cent of the total, which is nearly one car in thirteen turning up in a condition the tester judged an immediate risk.
That distinction decides how the owner gets home. A fail on major items, with the old certificate still valid, leaves the car legal to take away, provided it still meets the minimum standards of roadworthiness. A dangerous defect removes that option, whatever the certificate in the glovebox says, and a car in that condition should be recovered rather than driven.
The Faults That Fail the Most Cars
Two different figures get muddled on almost every page covering this subject. Lighting is the biggest defect group, appearing in nearly half of failed tests. The most common single defect is tyre tread. Both statements are true, and they answer different questions.
One point governs everything below. A failed test can carry several defects at once, so these shares overlap and do not add up to the failure rate. A car failing on a bulb, a spring and a bald tyre appears in three groups.
Lighting, the Biggest Group
Lighting and electrical defects appeared in 3,634,845 tests, which is 10.99 per cent of every test carried out and 48.22 per cent of all failures.
The precise meaning is worth stating plainly. That figure is the share of failed tests carrying at least one lighting defect. It is not the share of failures caused by lights, and many of those cars were failing on other things at the same time.
Inside the group, a lamp missing or not working is the biggest single entry at 575,748 failed tests, with 256,026 more fixed at the station. A stop lamp not working accounts for another 407,441 failed tests.
These are the cheapest faults on the entire list and the ones most often found by somebody else. A driver cannot see their own brake lights, which is exactly why the tester does.
Tyres, the Most Common Single Defect
Tread below the 1.6mm legal minimum is the most common single defect recorded anywhere in the data: 759,464 failed tests, 2.30 per cent of all tests, and 10.08 per cent of every failure. It sits in the dangerous category.
Two more tyre entries make the top ten. Cords visible or the tyre damaged accounts for 443,729 failed tests, also dangerous, and a tyre seriously damaged for 436,782. Across the board, tyre defects appeared in 6.43 per cent of all tests.
The advisory data shows what is coming. Tread approaching the limit was recorded on 5,308,869 tests, 16.06 per cent of the total. Those are next year’s failures, already identified and handed to the owner in writing.
Suspension, Brakes and Visibility
Suspension defects turned up in 8.77 per cent of tests. A fractured or seriously weakened spring is the second most common single defect in the country at 671,922 failed tests, with a worn suspension ball joint at 483,168, a worn pin or bush at 408,814 and a steering ball joint with excessive play at 360,480.
Brake defects appeared in 6.76 per cent of tests. Brake linings or pads worn below 1.5mm account for 606,408 failed tests and fall into the dangerous category. Parking brake efficiency below the required level adds a further 370,699.
Visibility is the other reliable source of failures. A wiper blade not clearing the screen properly accounts for 495,197 failed tests, and a split or insecure CV joint boot, found on the same underside inspection as the suspension items, adds 434,422.
Look down the thirteen most common defects and one thing stands out by its absence. Not one of them involves the engine or the gearbox.
What Fails at Each Age of Car
Age predicts the result better than anything else in the data. The failure rate almost quadruples between the youngest cars tested and the oldest, and the mix of faults changes along the way.
The Failure Rate by Age
Cars under three years old failed at 8.86 per cent across 1,511,990 tests. Most of that band is made up of taxis and private hire vehicles, which sit in class 4 and are tested from one year old rather than three. Cars taking their first test at three years old failed at 9.68 per cent.
From there the climb is steady. Cars aged four to six failed at 13.12 per cent, those aged seven to nine at 20.27 per cent, and those aged 10 to 12 at 27.78 per cent.
The oldest bands sit close together. Cars aged 13 to 15 failed at 33.26 per cent and those aged 16 or more at 34.50 per cent. The flattening at the top says something about which cars survive that long, and who is looking after them.
What Changes as a Car Gets Older
Tyres lead the defect groups on cars up to six years old. A young car has done its mileage in a short space of time, its suspension and electrics are intact, and the only things worn out are the parts that touch the road.
From seven years, lighting takes over as the leading group, appearing in 7.81 per cent of tests in that band and rising to 20.57 per cent of tests on cars aged 16 or more. Bulbs, connectors, earths and lenses accumulate faults as a car gets older.
Corrosion enters the top five groups only at 16 years and above. Structural rust takes years of salt and wet to reach a point a tester records, which is why it is absent from every younger band.
The pattern is not a mystery. Consumables go first on mileage, electrical faults and suspension wear arrive with time, and corrosion is the last to show.
What This Means Before Your Test
For a car under seven, the money is best spent on the basics. Check the tread across the full width of all four tyres, walk the lights with someone pressing the pedal, and replace wipers that smear. A car of that age rarely fails on anything an owner could not have found.
Between seven and twelve, the odds roughly double and the faults move underneath. Springs, ball joints, bushes and pad thickness decide the result, and none of them can be assessed on the driveway. This is the age at which a check on a ramp before the test earns its keep.
At thirteen and above, a third of cars fail. Corrosion, brake pipes and worn steering joints join the list, and the repair bill starts to weigh against what the car is worth. Knowing what is coming before the test gives the owner the choice of where the work is done.
The Checks That Prevent a Failure
A fair share of the most common defects are visible from outside the car with nothing more than a coin and ten minutes. Lights, tyres and wipers between them account for a large part of the failure list.
The Ten Minute Driveway Check
Start with the lights. Work through sidelights, dipped and main beam, indicators front and rear, hazards, fog lamps, reversing lights and the number plate lamp. Brake lights need a second pair of hands, or a reflective surface such as a garage door or a shop window at dusk.
Tyres take a 20p coin. The raised outer band on a 20p sits close to the legal minimum, so push the coin into a main tread groove and look: band hidden, the tread is above the limit; band visible, the tyre needs a proper gauge and probably replacing. Check several points across the width and around each tyre, and look at the sidewalls for cuts, bulges or exposed cords.
Wipers come next. A blade that smears, judders or leaves an arc of water in the swept area fails, and blades are a few pounds. Top the washers up, check both jets fire onto the screen, and look at any chip or crack in the area the driver looks through.
Finish with the odds and ends. The number plate should be legible and correctly spaced, mirrors secure, the horn working, seatbelts free of fraying and latching properly, doors and boot opening and closing, and no warning lights staying on once the engine is running.
What Needs a Garage
Everything under the car is beyond a driveway check. Springs, ball joints, bushes, CV boots, pad thickness and parking brake efficiency appear between them in almost three million recorded failures, and none can be judged without the wheels off the ground.
The cheap way to get them looked at is to ask while the car is already up. A service, a tyre change or a brake job all put the car on a ramp, and a request to check the suspension and pad thickness at the same time costs nothing extra.
Wheel bearings belong on that list too. They appeared in 153,736 failed tests, 0.47 per cent of all tests and 2.04 per cent of failures, with a further 279,656 recorded as advisories, and a worn bearing announces itself long before test day.
Timing the Test
The rules reward testing early. GOV.UK sets out that a car can be tested up to a month minus a day before the certificate runs out while keeping the same renewal date, so a certificate expiring on 15 May can be tested from 16 April with no loss of cover.
Test earlier than that and the renewal date moves to a year minus a day from the date the car last passed, which throws away the remaining days on the old certificate. Testing inside the window costs nothing and buys up to four weeks.
That month is what turns a fail into an inconvenience rather than a crisis. With the old certificate still valid and no dangerous defects recorded, the car can be taken away and booked in for repairs at a garage of the owner’s choosing, at a price the owner has had time to compare.
What the MOT Does Not Check
The test is a minimum roadworthiness standard measured on one day. It is not an inspection of a car’s overall condition, and a certificate says nothing about how long any part of the car will last after it.
Not a Service, and Not a Health Check
Engine wear, gearbox condition, clutch life and the state of the oil sit outside the test entirely. A car with a tired engine and a slipping clutch passes, provided its lights, brakes, tyres and structure meet the standard.
Advisories are the closest the test comes to a condition report, and they are warnings rather than failures. Brake discs or drums recorded as seriously weakened appeared on 2,954,890 tests, and fluid leaking from the engine on 1,557,417. None of those cars failed on those items.
A pass means the car met a minimum standard on the day of the test. It is no evidence that the car has been maintained, and a fresh certificate on a used car should be read that way.
The Camshaft Drive, Which Nobody Inspects
There are 4,432 defect codes available to a class 4 tester. Not one of them covers a timing belt, a cam belt or a timing chain. The camshaft drive is not inspected at any point in the test.
That produces the sharpest example of the gap between passing and being in good order. A car can pass its MOT with a belt years beyond its replacement interval, and a belt failure on an interference engine can cost more than the car is worth, which is a fail no certificate ever predicted.
Establishing when that belt is due has itself become harder, now that manufacturers no longer publish the interval in a form an owner can look up. The figure now comes from a franchised dealer, against the registration, and it belongs in the service file alongside the MOT certificates.
If you enjoyed this article, be sure to follow us on Microsoft Start.

Leave a Comment
More in News

How Thieves Unlock Your Car From the Street Using Your Key Fob While It Sits Indoors

How Long Brake Pads Actually Last and What Garages Charge When You Leave It Too Late

What to Check Under the Bonnet Every Month to Avoid a Breakdown
What the New AI Cameras Can See Inside Your Car and What the Fine Is If They Catch You

Renault 5 E-Tech Gains Up to 259-Mile Range for MY27 with No Price Rise
Trending on Motoring Chronicle

Piloti Ferrari 296 Speciale: an exclusive configuration reserved for Ferrari client-racing drivers [Photo Gallery]

How Long Does a Serpentine Belt Last? (5 Warning Signs It’s Failing)

10 Effective Tips For Buying A Car

UK New Car Market Posts Best May Since 2019 as Private Buyers Return