UK Drivers’ Car Insurance Costs Rise 4.3 Percent a Year, ONS Confirms
UK Drivers’ Car Insurance Costs Rise 4.3 Percent a Year, ONS Confirms
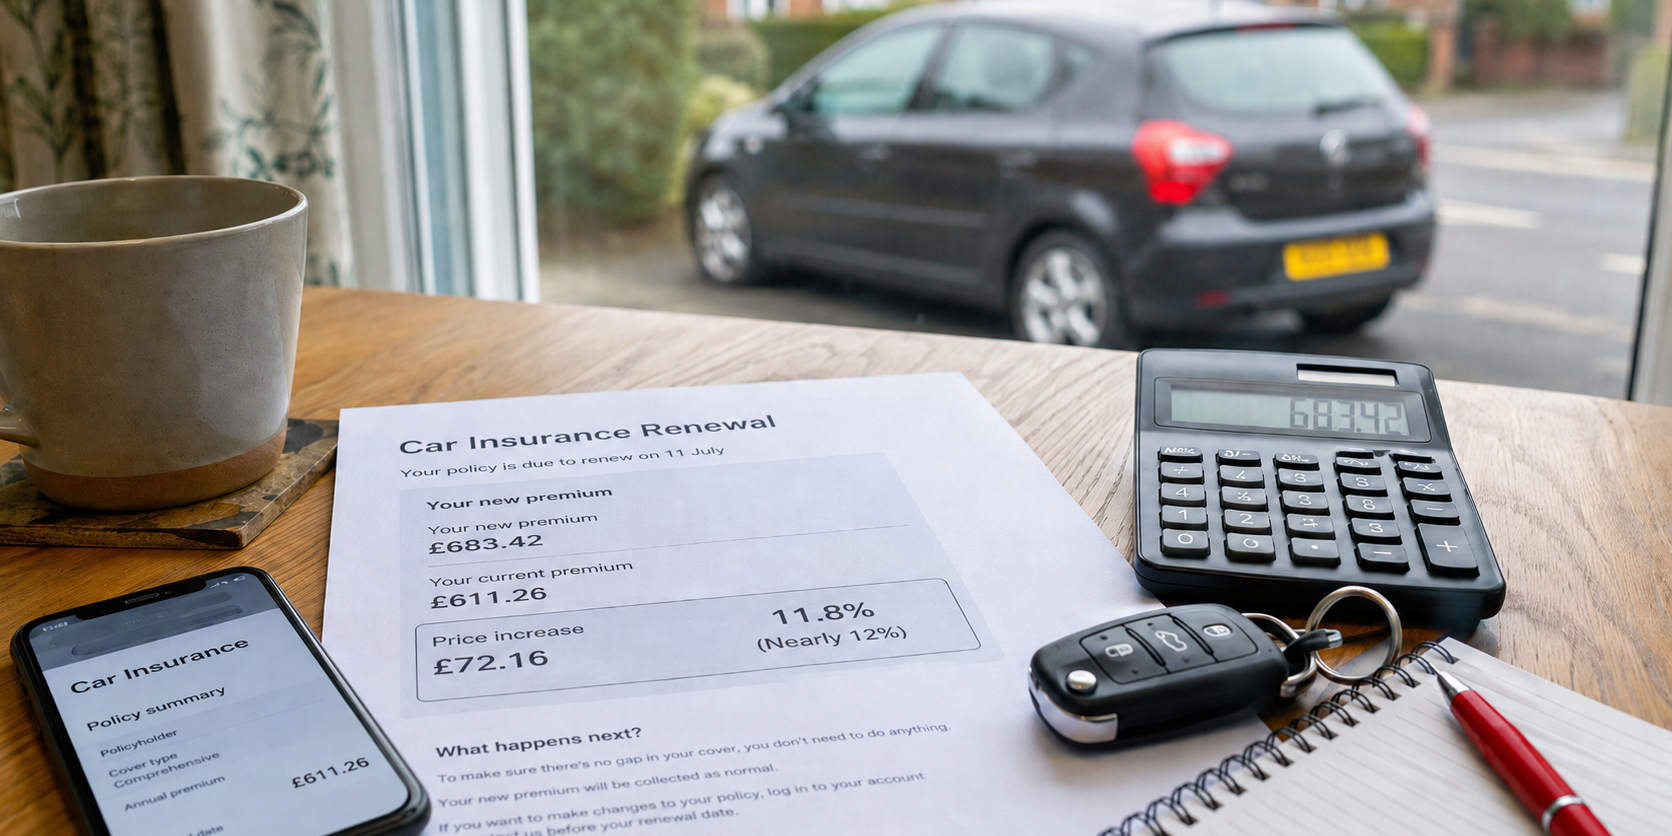
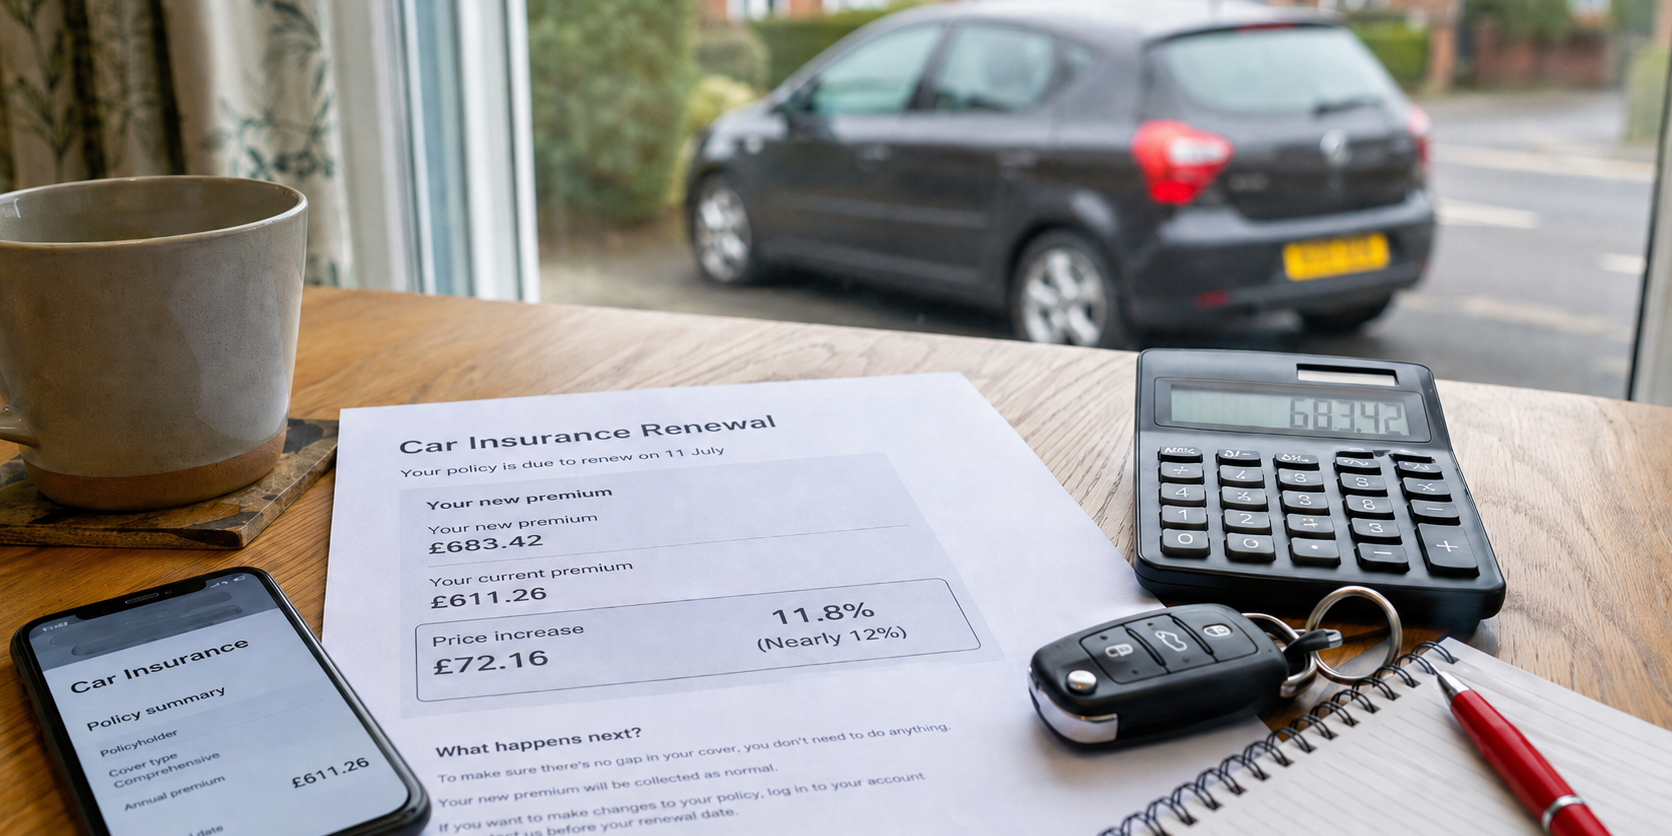
- The Office for National Statistics’ motor insurance price index rose 4.3 percent in the year to August 2026, official figures published on 16 September 2026 show.
- The index climbed from 180.5 points in August 2025 to 188.3 points in August 2026, after peaking at 190.8 points in July 2026.
- Insurance costs are now rising faster than general prices in the shops, where headline inflation has been running at under half that rate.
Car insurance is going up faster than almost everything else drivers buy, and this time the number comes straight from the government’s own statisticians rather than a comparison website. The Office for National Statistics tracks the price of motor insurance every month as part of its consumer prices basket, and the reading published on 16 September 2026 puts annual insurance inflation at 4.3 percent for the year to August 2026. That is the official measure used to set benefits, pensions and wage negotiations across the country, and it says your premium is climbing at nearly double the pace of prices generally.
The ONS motor vehicle insurance index stood at 180.5 points in August 2025. A year later it had reached 188.3 points, an increase of 7.8 points, or 4.3 percent. That is the official, audited number, built from real prices insurers charge policyholders across the country, not a survey of quotes or a single comparison site’s own book of customers.
This is the same index economists and the Bank of England watch when they assess how much of overall inflation is being driven by insurance specifically, rather than fuel, food or rent. It draws on actual billed prices rather than quoted prices, so it captures renewals alongside new policies, which is one reason its reading can move differently from a comparison site’s index built almost entirely from prospective quotes rather than what existing customers end up paying after their policy renews.
Why the Official Number Tells a Different Story to the Comparison Sites
Every few weeks a different insurance comparison site puts out its own price index, and the headline figures rarely agree with each other, as each one is built from the quotes searched on that particular platform rather than the policies people actually buy. The ONS index is different. It is compiled from a representative basket of actual insurance prices collected specifically for the Consumer Prices Index, the same statistical machinery that measures the cost of bread, rent and petrol. When the ONS says insurance is up 4.3 percent, that figure carries the standing of an official national statistic, not a marketing release.
The data also shows the rise has not been a straight line. The index actually fell sharply between December 2025 (179.4 points) and February 2026 (179.3 points), before climbing steadily through the spring and early summer. It reached its highest point of the past year in July 2026, at 190.8 points, then eased back to 188.3 points in August. That pullback of 1.3 percent in a single month is the first sign of relief drivers have had after months of steady increases, though the year-on-year comparison still shows costs running well above where they stood twelve months earlier.
To put the 4.3 percent annual rise in context, the ONS’s headline Consumer Prices Index for the same period has been running at under half that pace. Motor insurance has been one of the categories pulling household budgets upward for over a year now, sitting alongside food and energy as one of the sharper increases in the monthly shopping basket. For a driver whose renewal quote jumps by more than the average pay rise they received this year, the ONS data confirms what the letter from their insurer already told them: cover is getting more expensive faster than almost anything else they buy.
The ONS does not publish a postcode or age breakdown alongside this particular index, so it cannot say which drivers are hit hardest. What it can say is that the trend is national and sustained. The index has been above its year-ago level in every single month from early 2025 onwards, meaning anyone renewing a policy this autumn is highly likely to be paying more than they did at their last renewal, though the pace of increase has slowed slightly from its July peak.
Can You Avoid It
There is no way to sidestep national insurance inflation entirely, but there are concrete steps that reduce how much of it lands on your own renewal notice. Shopping around at every renewal rather than accepting the automatic rollover price is still the single biggest lever available to most drivers; insurers routinely quote existing customers more than they quote a new customer with an identical risk profile, a gap the regulator has spent several years trying to close through rules that ban price walking, but which still shows up in practice on many renewal letters.
The gap between the cheapest and the most expensive quote for the same driver and the same car can run into hundreds of pounds, which is why comparing at least three sources, a comparison site, a direct insurer and, where available, a broker, tends to turn up a wider spread of prices than sticking to a single site. Drivers who let a policy auto-renew without checking the market at all are, on the current data, renewing into a market that has climbed 4.3 percent in the past twelve months without ever testing whether a cheaper option exists.
Paying annually rather than by monthly instalment removes the interest charge many insurers add to spread the cost, which can amount to the equivalent of an APR in the teens or twenties on what is effectively a loan. Increasing a voluntary excess lowers the premium, though only by an amount worth checking against the extra cost of a claim before committing to it. Naming an older, more experienced second driver on the policy, even one who rarely drives the car, can lower the calculated risk score for some insurers, while adding a named driver purely to reduce the price when they will not actually be the main user is fronting, which is insurance fraud and can void a policy entirely if discovered.
Black box and telematics policies remain one of the more effective ways to bring a premium down for drivers whose actual habits are lower risk than their age or postcode alone would suggest, and they tend to help younger drivers most, a group typically quoted the highest premiums in the market. Building and protecting a no claims discount by avoiding small claims that cost less than the resulting premium increase is another lever worth setting against the likely premium rise before calling the insurer after a minor scrape. Checking the renewal date against the calendar makes a real difference too: quotes obtained around three weeks before a policy expires tend to come in cheaper than quotes obtained on the day of renewal itself, giving a driver time to negotiate or switch before the existing cover lapses.
Paying for cover across twelve equal months rather than accepting whatever payment plan an insurer defaults to is worth double checking each year too, as providers periodically change their own instalment terms without drawing much attention to it in the renewal paperwork.
It is also worth reviewing the level of cover itself rather than assuming the cheapest headline price is the best deal. Fully inclusive policies that cover damage to your own car have, in many cases, become cheaper than bare third party only cover for certain driver profiles, an anomaly caused by the type of driver who tends to buy the minimum legal cover rather than any change in the risk itself, so checking both options at every renewal rather than assuming the fuller policy always costs more is worth the extra few minutes. Bundling breakdown cover or legal protection into a single annual policy, rather than buying each separately across the year, can also trim a percentage point or two off the combined bill for drivers who would buy both anyway.
None of these steps will reverse a 4.3 percent national trend on their own, but together they routinely save individual drivers a meaningful slice of what the official data says the market as a whole is now charging. For a driver facing a renewal letter this month, the ONS figures are less a prediction and more a description of where the market already stands, and acting on that description before the renewal date passes is the one part of the equation still within a driver’s own control.
Sources
Office for National Statistics, Consumer Price Inflation time series, “CPI INDEX 12.5.4.1: Motor vehicle insurance (2015=100),” series L7JE, data published 16 September 2026, covering August 2026.

Leave a Comment
More in News

How to Spot a Clocked Car (and What to Do If Caught Out)
What Dashcam Footage Actually Counts as Evidence (and the Rules on Sharing It)
Why Connecticut Is Adding Speed Cameras to School Zones Across the State
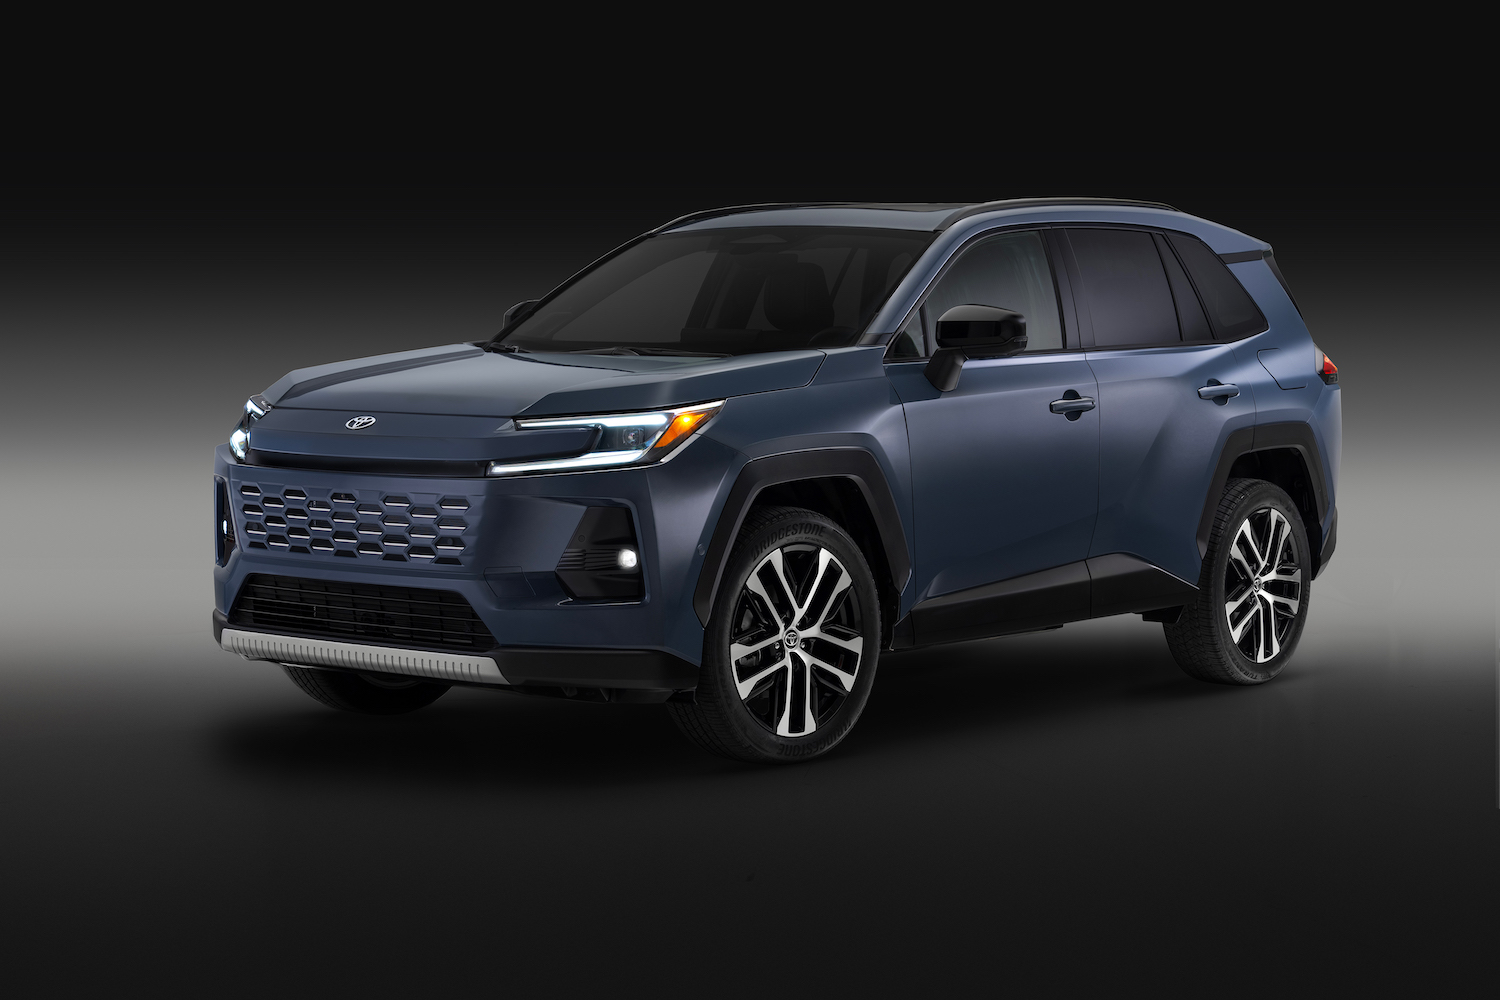
Toyota Recalls 30,978 RAV4 Plug-in Hybrids Over Sudden Power Loss Risk
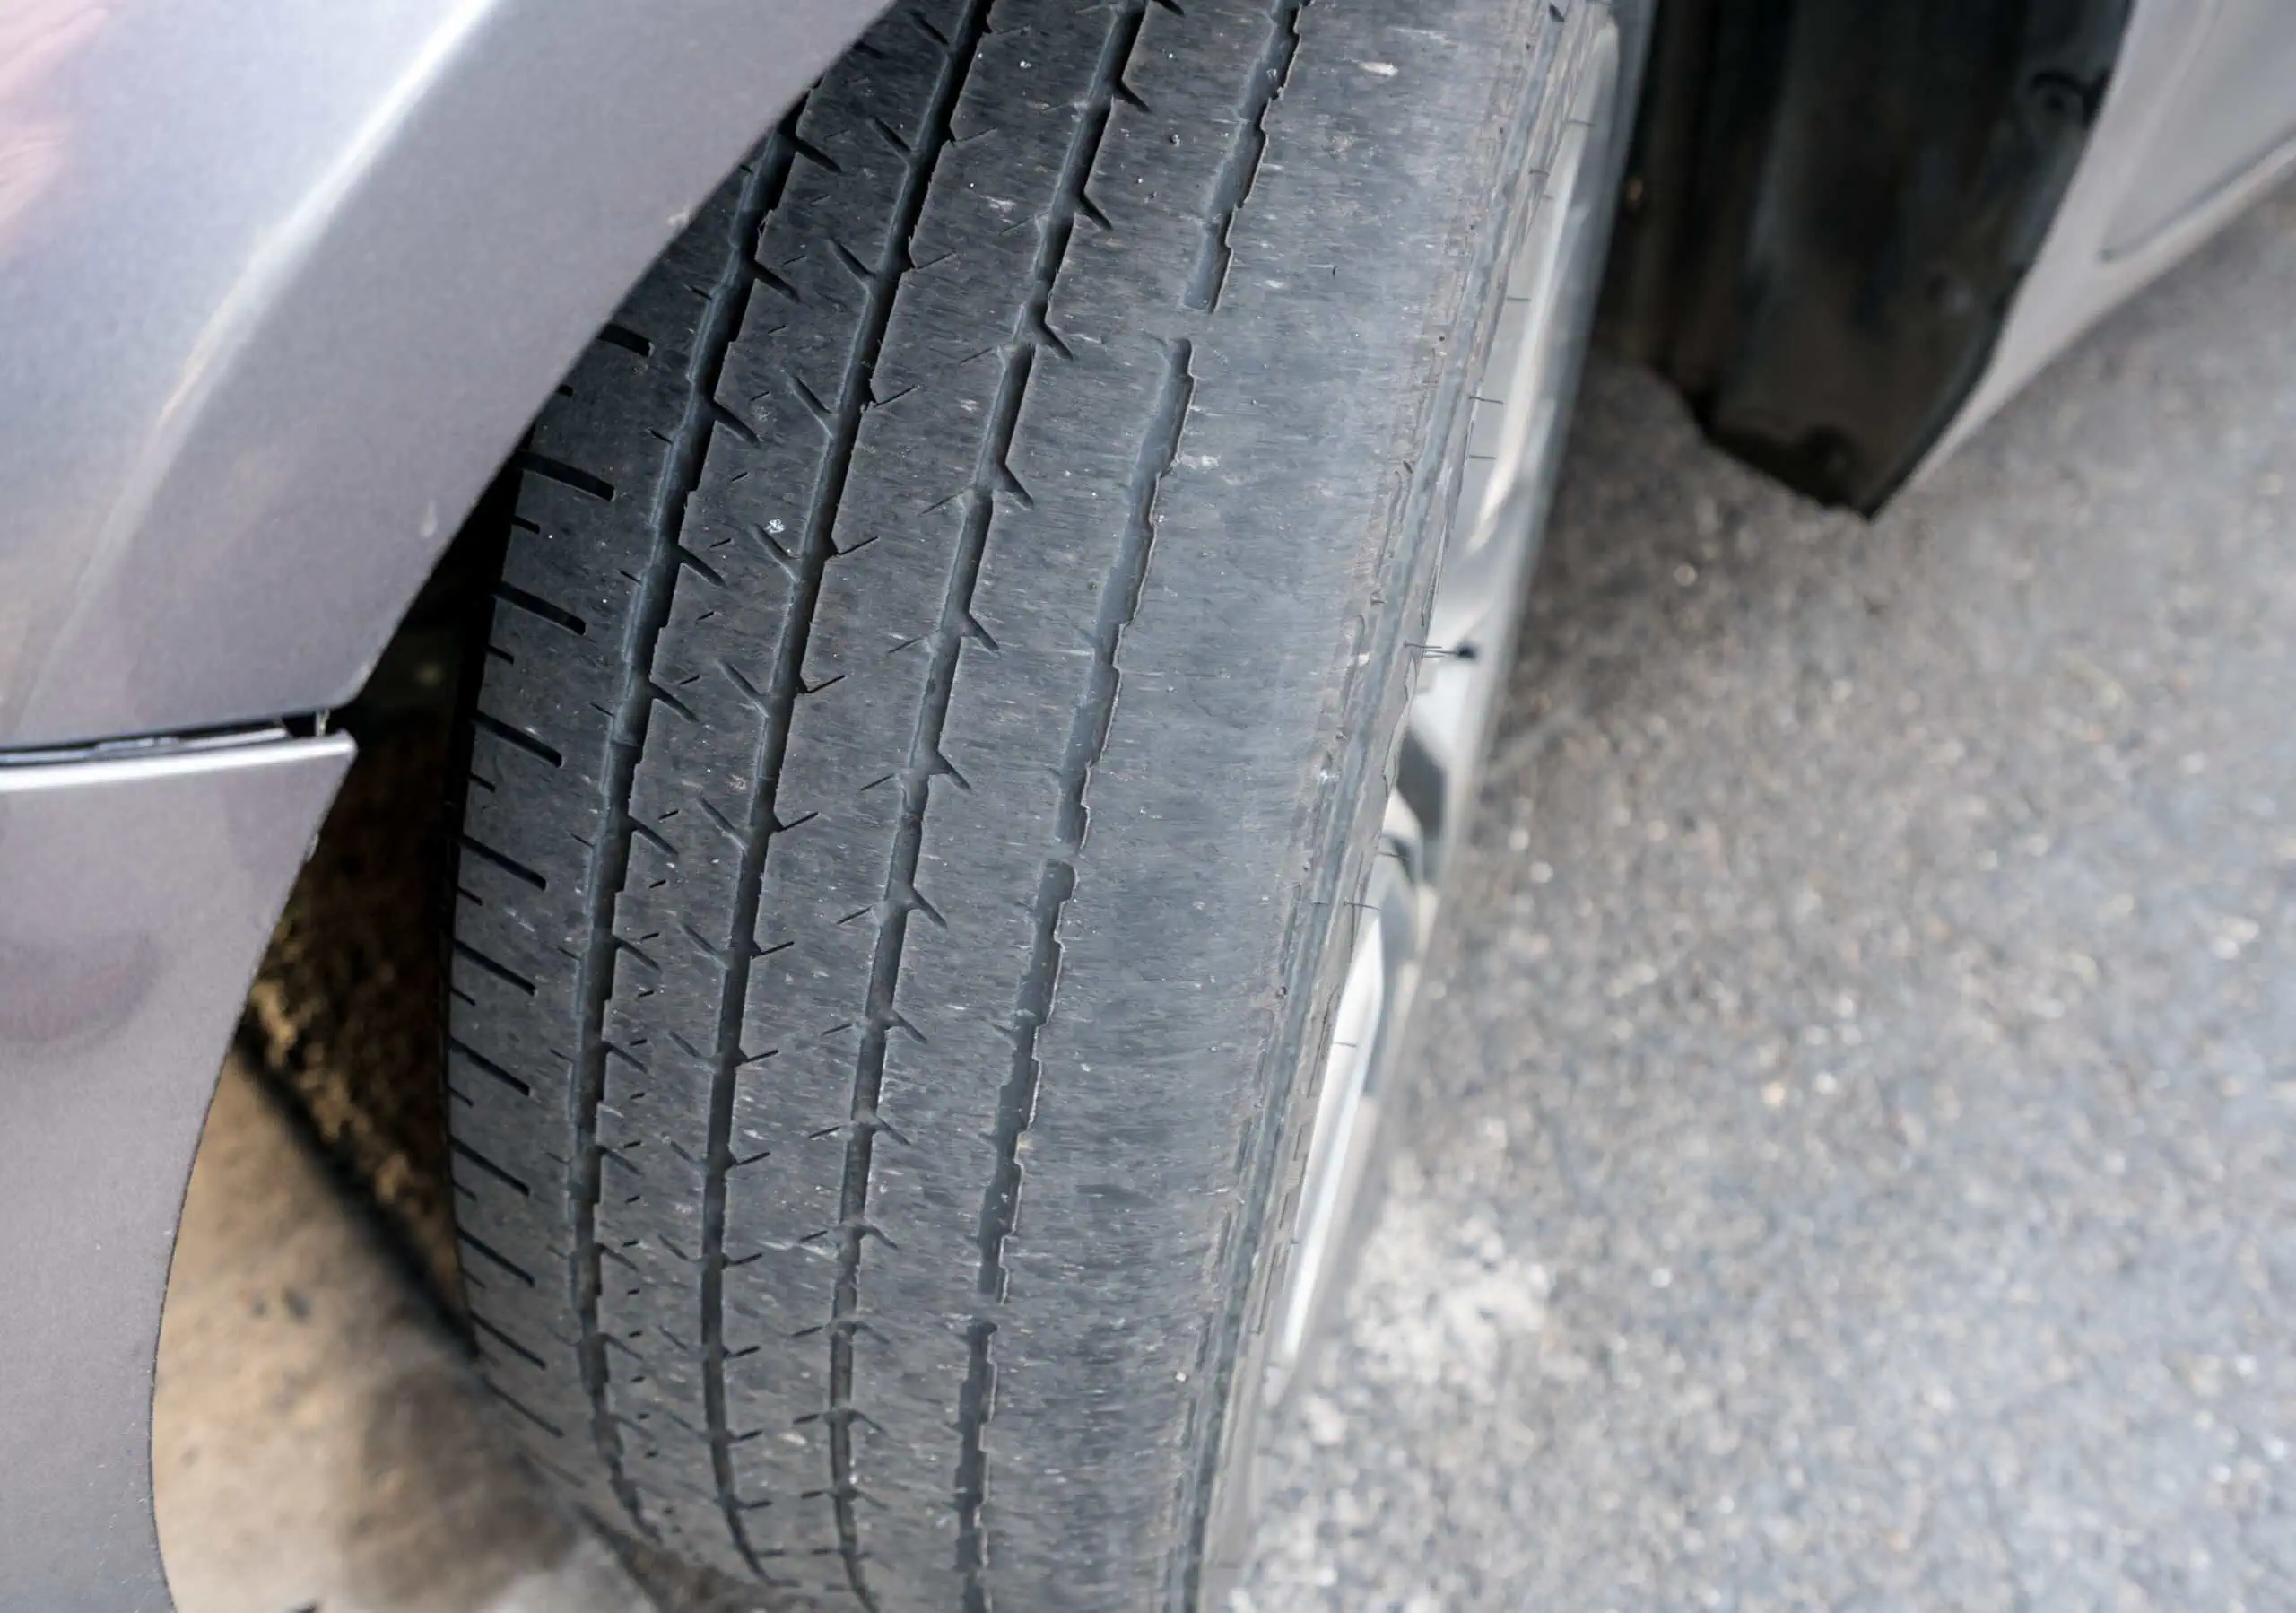
Why Your Steering Wheel Shakes at 70mph and the £10 Fix for It
Trending on Motoring Chronicle
Men pay more than double in speeding fines, new research reveals

US Gas Prices Hit a Record August High of $4.10 a Gallon

How To Test If Your Eyesight Is Fit For Driving (With Expert Tips From A Practising Optometrist)

Diesel Prices Cross $6 a Gallon for the First Time in US History