
Cambridge Searches for Used Cars More Than Anywhere in the UK, and London Finishes 31st


Cambridge, a city better known for its bicycles than its car dealers, records more online searches for used cars per head than any other city in the UK. New research ranks 50 cities by search interest, and finds the most active searches more than eleven times as often as the least. London, the city with by far the most searches overall, lands outside the top 30 once its population is taken into account.
Cambridge and Reading Lead the Country
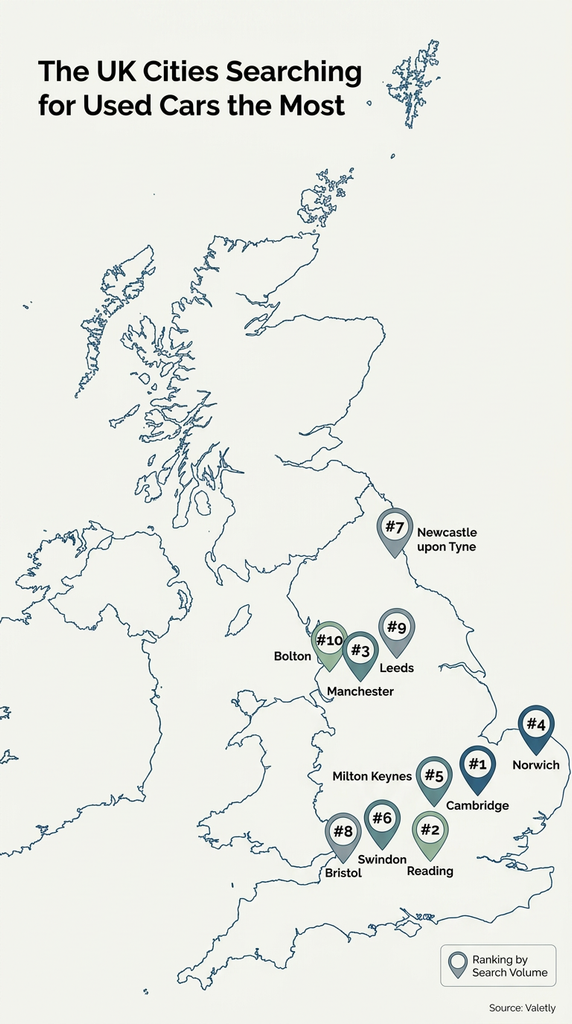
Cambridge comes first on 1,041.4 monthly searches per 100,000 residents. Reading follows on 902.3, with Manchester on 685.4 and Norwich on 673.6 broadly level in third and fourth.
Below them, six cities from Milton Keynes to Bolton sit within about 35 points of one another, all scoring between 589.7 and 625.
The top ten:
- Cambridge: 1,041.4 per 100,000
- Reading: 902.3 per 100,000
- Manchester: 685.4 per 100,000
- Norwich: 673.6 per 100,000
- Milton Keynes: 625 per 100,000
- Swindon: 621.6 per 100,000
- Newcastle upon Tyne: 609.3 per 100,000
- Bristol: 608.8 per 100,000
- Leeds: 602.4 per 100,000
- Bolton: 589.7 per 100,000
Nicolas Diez, founder of Valetly, said: “Cambridge coming top surprised me. It’s a cycling city. But 1,041 searches per 100,000 people is a lot of interest. My guess is some of that comes from people living in the villages outside who commute in, plus students and researchers arriving for a year or two who want something cheap to run. Reading on 902 hints at something similar, with commuters along the M4 looking at second-hand rather than new.”
London Tops the Raw Count and Falls to 31st
London records 30,970 used car searches a month, more than any other city in the study by a wide margin. Spread across a population of more than nine million, that comes to 341.3 per 100,000 residents, enough for only 31st place.
Birmingham, the second largest city in the research, finishes 12th on 581.1.
Diez said: “London is the one people will talk about. Nearly 31,000 searches a month, more than anywhere else by miles, and yet per head it’s 31st. That points to lower demand relative to the size of the city, which fits with ULEZ and the number of people there who manage on the Tube and buses.”
Nottingham Finishes Last
Nottingham sits at the bottom of all 50 cities, with 300 searches a month, or 90.4 per 100,000 residents. That is less than a tenth of Cambridge’s rate. Cambridge has fewer than half of Nottingham’s population, yet generates five times as many searches.
Diez suggested buyers in Nottingham could be searching by dealer name or by a nearby town, rather than typing the generic terms the study tracked.
The bottom five:
- Blackpool: 151.1 per 100,000
- Sunderland: 148 per 100,000
- York: 146.9 per 100,000
- Slough: 140.2 per 100,000
- Nottingham: 90.4 per 100,000
What to Check Before You Buy
For anyone among those searching, Diez’s advice focuses on what a fresh clean can hide.
“If you’re one of the people searching, look past the shine,” he said. “A fresh valet can hide a lot. I always check the driver’s seat bolster and the steering wheel first. Heavy wear on a car showing 30,000 miles doesn’t add up. Lift the boot floor and feel for damp. Pull back the door seals. In my experience, a car that’s been kept clean inside for years usually had its servicing kept up too, and it holds its value better when you come to sell.”
Interior wear set against the recorded mileage is one of the simplest checks a buyer can make on a viewing. It sits alongside the MOT history, which records the mileage at every test, and a check for any write-off marker on the car’s history.
The Full Ranking
Searches per 100,000 residents, with total monthly searches in brackets:
- Cambridge: 1,041.4 (1,510)
- Reading: 902.3 (1,570)
- Manchester: 685.4 (3,790)
- Norwich: 673.6 (970)
- Milton Keynes: 625 (1,550)
- Swindon: 621.6 (1,150)
- Newcastle upon Tyne: 609.3 (1,840)
- Bristol: 608.8 (3,010)
- Leeds: 602.4 (3,030)
- Bolton: 589.7 (1,150)
- Oxford: 585.5 (890)
- Birmingham: 581.1 (6,630)
- Glasgow: 557.5 (3,540)
- Derby: 533.1 (1,370)
- Plymouth: 518.9 (1,370)
- Middlesbrough: 514.3 (720)
- Bournemouth: 482.2 (950)
- Coventry: 469 (1,740)
- Liverpool: 459.8 (2,290)
- Warrington: 457.1 (960)
- Peterborough: 428.6 (870)
- Dundee: 426.7 (640)
- Huddersfield: 425.9 (690)
- Ipswich: 424.5 (590)
- Edinburgh: 423.1 (2,230)
- Portsmouth: 420.2 (1,000)
- Stoke-on-Trent: 418 (1,070)
- Belfast: 417.4 (1,440)
- Kingston upon Hull: 373.1 (970)
- Aberdeen: 349.3 (800)
- London: 341.3 (30,970)
- Swansea: 340.1 (840)
- Luton: 338 (720)
- Gloucester: 328.2 (430)
- Southampton: 308.3 (780)
- Telford: 282.4 (480)
- Wolverhampton: 276.5 (730)
- Cardiff: 262.9 (970)
- Brighton: 253.3 (580)
- Birkenhead: 246.5 (350)
- Sheffield: 232 (1,290)
- Leicester: 231 (850)
- Bradford: 212.3 (1,140)
- Newport: 207.5 (330)
- Northampton: 181.8 (420)
- Blackpool: 151.1 (210)
- Sunderland: 148 (410)
- York: 146.9 (310)
- Slough: 140.2 (230)
- Nottingham: 90.4 (300)
If you enjoyed this article, be sure to follow us on Microsoft Start.

Leave a Comment
More in News
Queensland Drug Driving Fines Double to $4,835 From 1 December

‘You have the newer Toyota’: Woman goes to dealership for oil change. Then a worker refuses because she’s only gone 5,000 miles

First LA Speed Camera Warnings Expire Dec. 25, Then Fines Run $50 to $500
Queensland’s 5c Petrol Rise Cap Faces a No Vote as Victoria Runs Daily Caps

Sachs and LuK Give No Mileage for a Dual Mass Flywheel. They Give Tests
Trending on Motoring Chronicle

AA Data Shows Computer Faults Cost Drivers Up To £900 as Breakdowns Double

How to Open a Frozen Car Door Without Breaking the Handle or Seal

Steering Wheels: The 9 and 3 Paradigm

36,994 Lincoln Navigators Can Move the Front Passenger Seat on Their Own
