
Why UK Roads Are Busier Than at Any Point Since 2019 and What It Could Cost You
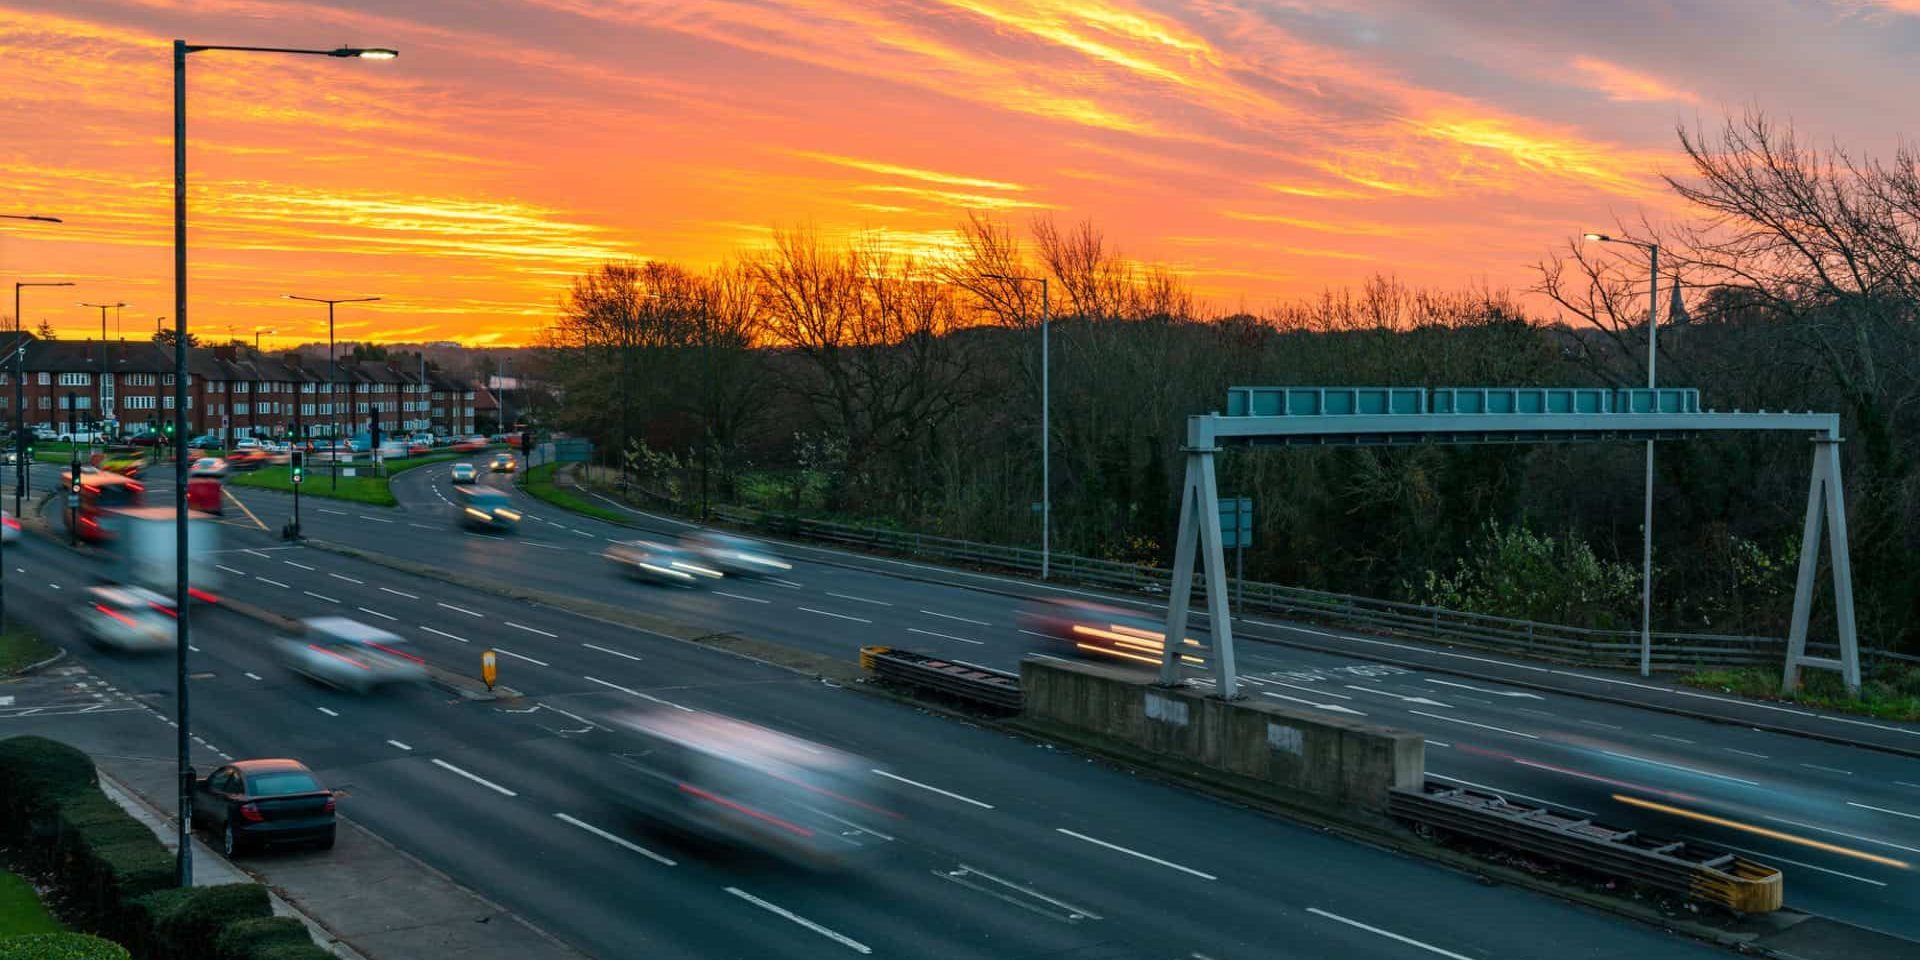

UK road traffic has now surpassed pre-pandemic levels for the first time since 2019, according to Department for Transport figures published earlier this year. The recovery has been building gradually since lockdown restrictions ended, but the crossing of that threshold marks a significant moment for anyone who uses British roads regularly. More vehicles means longer journeys, higher running costs in some cases, increased wear on roads, and a changed risk environment that has concrete financial implications for drivers.
This is not simply a statistical footnote. The return of traffic to above 2019 volumes comes at a time when road conditions, insurance costs, and fuel expenses are all under pressure, and understanding the connection between them helps drivers make better decisions about when, how, and what they drive.
What the Traffic Data Actually Shows
The Department for Transport publishes quarterly and annual road traffic estimates covering all vehicle types across the UK road network. The 2024 annual figures, published in early 2025, showed total traffic volumes on UK roads at their highest level since 2019. The 2025 data confirmed the trend continuing upward into 2026, with motorway and A-road traffic in particular returning to and exceeding pre-pandemic levels.
The pattern is not uniform across all road types. Motorway traffic recovered more quickly than urban roads, reflecting the earlier return of long-distance commuting, freight, and business travel. Some urban areas, particularly in central London, still show lower car traffic volumes than 2019 due to increased working from home, the expansion of low traffic neighbourhoods, and the ULEZ charging zone. But on the national network as a whole, the aggregate has crossed the 2019 baseline.
Heavy goods vehicle traffic has been particularly resilient, driven by supply chain activity, construction, and the growth of e-commerce delivery. Van traffic remains significantly above pre-pandemic levels as home delivery volumes remain elevated compared to 2019. The combination of goods vehicles and private cars is what has pushed total network volumes back above the threshold.
Journey Times and Congestion: What Drivers Are Already Experiencing
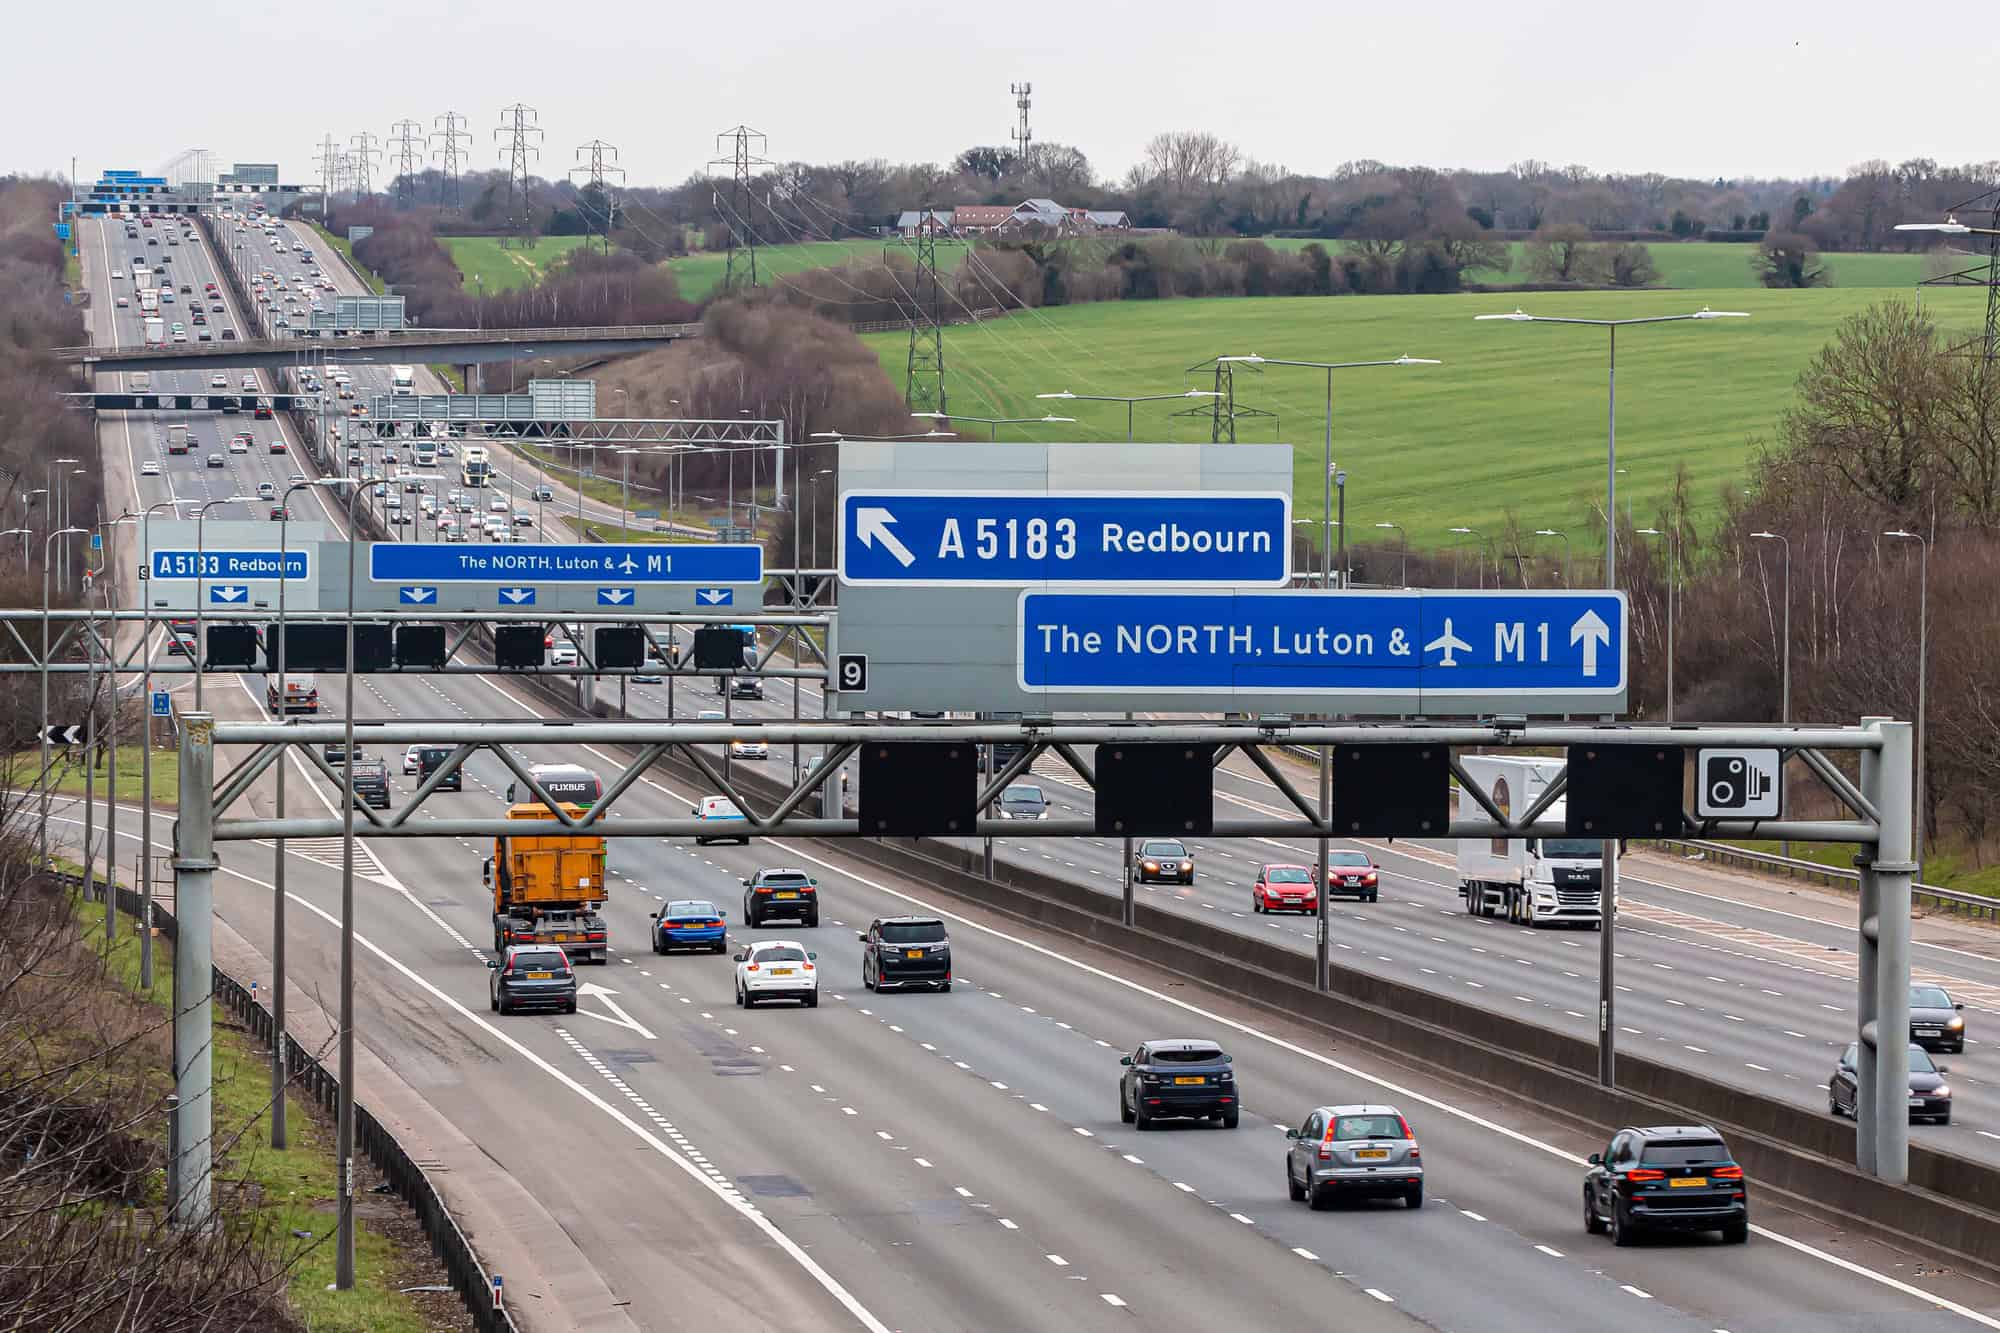
The practical consequence of more vehicles on a road network that has not significantly expanded in capacity is longer journey times. Traffic analytics data from TomTom, INRIX, and the RAC Foundation consistently shows that average UK journey times on congested routes are running above 2019 benchmarks on many corridors, particularly around major urban centres during morning and evening peaks.
For regular commuters, the time cost is tangible. A journey that took 35 minutes in 2020 or 2021, when roads were quieter, may now take 50 minutes on the same route at the same time of day. For drivers who use fuel-intensive vehicles, congestion adds directly to fuel costs because stop-start driving in queues burns significantly more fuel per mile than steady-speed motorway driving. A driver spending an extra two hours a week stuck in traffic on routes that were clear three or four years ago is paying for that in petrol or diesel as well as time.
Freight operators and courier companies have been absorbing these delays into their scheduling and cost models, which contributes to delivery surcharges and logistics costs that ultimately appear in the price of goods. The road network does not exist in isolation from the broader economy, and congestion that affects commercial traffic has a wider economic footprint than most drivers think about.
The Pothole and Road Condition Problem Is Getting Worse
Higher traffic volumes accelerate road surface deterioration. More vehicles, and particularly more heavy goods vehicles, create more stress on road surfaces that are already under strain from underfunding of local road maintenance budgets. The Asphalt Industry Alliance’s annual survey of local road conditions, published in 2025, estimated that the backlog of carriageway repairs in England and Wales had reached over £16 billion, with an average road in England and Wales needing maintenance once every 80 years at current spending rates.
The pothole problem is not new, but it is being compounded by the return of traffic volumes to 2019 levels on roads whose condition deteriorated during the pandemic years and have not been fully restored. Drivers are reporting higher rates of tyre damage, wheel damage, and suspension wear on routes that were comparatively smooth during the low-traffic period.
This has a direct financial cost. The AA estimates that pothole-related vehicle damage claims from its members have been running at elevated levels in 2025 and into 2026. Tyre replacements, alignment checks, and suspension repairs following pothole strikes cost drivers hundreds of millions of pounds per year nationally. Local councils are legally responsible for maintaining roads in a safe condition, and drivers who suffer vehicle damage due to a pothole can make a claim against the relevant highway authority, though success rates vary and the process requires evidence that the pothole was previously reported.
How Busier Roads Feed Into Insurance Premiums
Car insurance pricing is driven partly by the statistical risk of a claim, and that risk increases when more vehicles are on the road. More traffic means more opportunities for collisions, more claims, and higher costs for insurers that are passed on to policyholders through premium increases.
UK motor insurance premiums rose sharply in 2023 and 2024, driven by a combination of higher repair costs, parts inflation, and increased claims frequency. The return of traffic to above 2019 levels is one contributing factor among several, but it is a factor. Drivers in areas where congestion has returned most strongly, typically around large urban centres and on commuter corridors, have seen some of the sharpest premium increases.
Telematics policies, which price insurance based on how and when you actually drive, can offer a route to lower premiums for drivers who avoid peak congestion times. If your driving habits allow you to travel outside the busiest periods, a usage-based policy may reflect that lower risk more accurately than a standard policy priced on the postcode and vehicle alone.
The Fuel Cost Dimension of Heavier Traffic
Petrol and diesel consumption is significantly higher in congested driving conditions than in free-flowing traffic. A vehicle achieving 45 miles per gallon on a clear motorway run may return 25 miles per gallon or less in stop-start urban queues. With traffic volumes above 2019 levels and journey times extending accordingly, the average driver who commutes on congested routes is using more fuel to cover the same distance than they would have in 2020 or 2021, even if the pump price per litre were identical.
For electric vehicle drivers, the equivalent calculation involves battery consumption in stop-start traffic versus motorway driving. Unlike petrol and diesel vehicles, EVs are actually more efficient in slow urban driving than at constant high speeds due to regenerative braking recovering energy. Congestion is less of a fuel-cost problem for EV drivers, though it still adds to journey time and associated costs.
For petrol and diesel drivers looking to manage fuel costs on congested routes, the most effective techniques are anticipatory driving that minimises unnecessary acceleration and braking, route planning that avoids the worst congestion pinch points, and timing journeys to avoid peak traffic where the schedule allows. None of these are novel pieces of advice, but the return of 2019-level traffic volumes makes them more financially relevant than they were when roads were quieter.
What Drivers Can Reasonably Expect in the Year Ahead
Traffic volumes are not expected to fall significantly. There is no structural change in commuting patterns, freight activity, or road capacity that would reduce volumes materially in the near term. Working from home rates have stabilised at a level that is higher than pre-pandemic but not high enough to keep traffic below 2019 levels overall.
The government’s Roads Investment Strategy includes spending on motorway upgrades and some trunk road improvements, but major new road capacity takes years to deliver from planning to opening, and local road maintenance remains chronically underfunded relative to the backlog. Drivers should expect the conditions visible in early 2026 to persist, with congestion on busy corridors, continued road surface deterioration, and the financial costs that accompany both.
Planning journeys with current traffic levels in mind, maintaining vehicles to handle road surface quality, and reviewing insurance arrangements to ensure they reflect your actual driving patterns are the practical responses available to individual drivers. The network itself will take years to improve meaningfully. Managing how you use it is the faster route to reducing what heavier traffic actually costs you.

Leave a Comment
More in News

Renewing Car Insurance on the Day Cover Ends Costs Drivers £331 More, MoneySupermarket Shows

Every Driver Faces £500 Seatbelt Fines as AI Cameras Flag 19,145 Possible Offences

How to Remove Moisture From Inside Your Headlight Before It Costs You £500

What Red and Amber Warning Lights Actually Mean (and Which Fail an MOT)

How to De-Ice Your Windscreen Fast Without Cracking It (and Staying Legal)
Trending on Motoring Chronicle

What a Sudden Heavy Steering Wheel Actually Means for Your Car’s Safety

Audi Q9 Flagship SUV Opens for UK Order in August With Seven Seats
What Labour’s New Highways Bill Means for Every Driver Who Could Soon Pay Tolls on New Roads

Jeep Recalls 1.08 Million Wranglers and Gladiators Over a Parked Car Fire Risk
