Boston Drivers Crash Every 3.76 Years as Brownsville Tops Safety Rankings Again

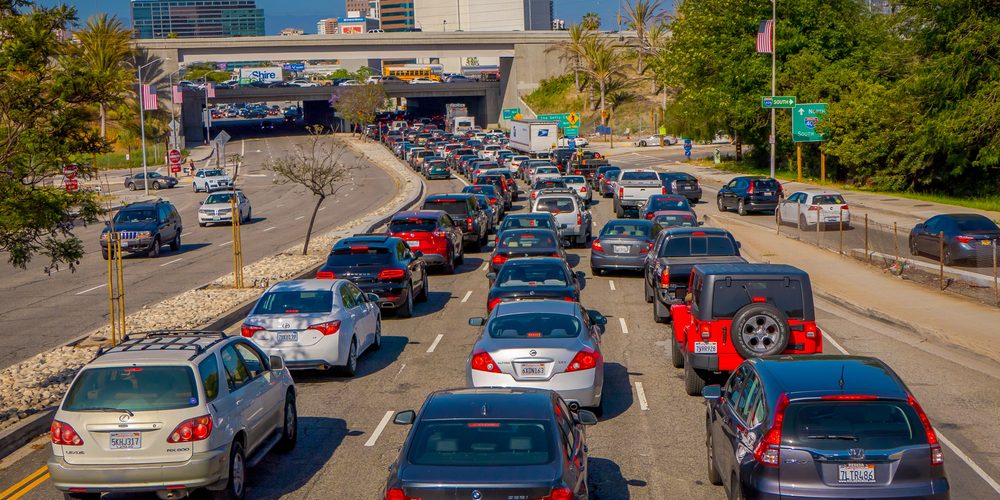
Drivers in Boston go just 3.76 years between collisions, while drivers in Brownsville, Texas, go nearly 15, according to Allstate’s 2026 America’s Best Drivers Report. The 18th edition of the study, released July 1, ranks the 200 largest US cities by how often their drivers file property damage claims, and the gap between the top and bottom of the table has real consequences for what residents pay to insure a car.
The average American driver experiences a collision once every 10.86 years, based on Allstate claims data covering about 10 percent of all US auto policies. Boston drivers run 189 percent above that national likelihood. Brownsville drivers run 27.5 percent below it, and the border city holds the number one spot for the second straight year.
Where you live shapes your crash risk, but the report’s new behavioral data makes a second point with equal force: the habits you control, from phone use to speed, move the needle wherever you park at night.
The Safest and Riskiest Cities of 2026
Texas and Colorado dominate the safe end of the table. Behind Brownsville sit Fort Collins, Colorado (14.96 years between collisions), Boise, Idaho (14.07), Laredo, Texas (13.82), and Cary, North Carolina (12.82). Madison, Wisconsin, Eugene, Oregon, and Olathe, Kansas, round out a top ten that welcomed two newcomers this year: McAllen, Texas, and Colorado Springs, which jumped 15 places.
The risky end of the list belongs to the Northeast, home to seven of the ten most collision-prone cities. Washington, DC sits at 199th with a collision every 4.24 years, followed by Baltimore (4.49), Worcester, Massachusetts (5.14), and Springfield, Massachusetts (5.18). Glendale and Los Angeles, California, Providence, Rhode Island, and Philadelphia fill out the group, with Sunrise Manor, Nevada, entering the bottom ten for the first time.
Massachusetts drivers can take some comfort in the fine print: Boston has held the last place spot for years, and dense colonial-era street grids, heavy commuter traffic and harsh winters all feed the claim numbers. The pattern is structural more than personal.
The Biggest Movers
About a third of the 200 cities moved ten spots or more year over year. Waco, Texas, made the biggest leap, climbing 40 places, followed by Savannah, Georgia (up 30) and New Orleans and Kansas City, Kansas (each up 29). Georgia stood out as a state on the rise, with Savannah, Macon and Columbus all climbing 20 spots or more.
Detroit took the steepest fall, dropping 38 places. Rockford, Illinois, slid 34, Arlington, Virginia, fell 20, and Tampa and Anchorage each lost 18 or more. The Midwest posted several of the sharpest declines, including Omaha (down 16), Milwaukee (down 15), Chicago (down 13) and Indianapolis (down 11). Shifting traffic patterns, construction and post-pandemic commuting changes can all push a city up or down the table within a single reporting cycle.
What Driving Habits Reveal
New to the 2026 edition, Allstate paired its claims rankings with anonymized behavioral data from Drivewise, its telematics program, collected across 2025. The data maps four risk factors city by city, and the results read like a national diagnosis.
Nighttime driving runs highest in Washington, DC, Northern Virginia and the Las Vegas Valley. Phone use behind the wheel peaks in dense metros including Miami, Chicago, Washington and Boston. Bridgeport, Connecticut, leads the nation for speeding, defined as miles driven 15 mph or more over the limit, followed by Pittsburgh, Indianapolis, Chicago and three Alabama cities: Mobile, Birmingham and Huntsville. Hard braking clusters in North Carolina and Arizona, with Raleigh, Fayetteville, Durham, Chandler, Glendale, Tempe, Mesa and Gilbert all among the highest.
“Where you drive plays a role in your risk,” said Laura Hoffman, vice president of auto design and telematics at Allstate, who noted that how and when you drive counts just as much. Pairing claims data with the behavioral readings from Drivewise, she said, helps drivers take simple steps to prevent crashes and keep insurance costs down.
One methodology note worth knowing: the rankings rest on property damage claim frequency from January 2023 through December 2024, measuring how often drivers cause damage to others. Allstate says the report is not used to set insurance rates.
What It Means for Your Wallet
Claim frequency is the raw material of insurance pricing, and city-level differences of this size help explain why a driver with a clean record in Boston or Baltimore pays far more than an identical driver in Boise. An at-fault collision typically raises full coverage premiums by hundreds of dollars a year for three to five years, on top of the deductible and any rental costs.
Drivers cannot change their zip code easily, but they can attack the behavioral side of the equation. Telematics programs from most major insurers, including Drivewise and its competitors, offer discounts that commonly reach 10 to 25 percent for demonstrated safe driving. The behaviors they score are exactly the ones in this report: speed, braking, phone handling and time of day.
“You don’t have to overhaul your driving habits to make a difference,” Hoffman said. “Simple steps like slowing down, staying focused and giving yourself space can go a long way in helping reduce risk.”
The full 200-city rankings are available at allstate.com/best-drivers. Wherever your city lands, the report’s core math applies: fewer claims mean lower costs, and the driver holds more of that outcome than the address does.
\nHow to Lower Your Risk Wherever You Live
\n\n\nThe cost of a single at-fault collision goes beyond the repair bill. A typical claim brings a deductible of 500 to 1,000 dollars, a premium surcharge that lasts three to five years, and in some cases a lost claim-free discount on top. Stack those together and one bad merge can cost several thousand dollars over the life of the surcharge, which is why the years-between-collisions figure in this report translates so directly into money.
\n\n\nThe behavioral data points at the fixes. Following distance counters the hard braking that clusters in stop-and-go metros: three to four seconds of gap at highway speed gives reaction time that tailgating never will. Phone use responds to a settings change, with the do-not-disturb-while-driving modes on both iPhone and Android silencing notifications automatically once the car moves. Night driving risk drops when errands shift to daylight hours, a real option for the retirees and remote workers who now make up a large share of drivers.
\n\n\nTelematics programs turn those habits into discounts, commonly 10 to 25 percent for consistently safe scores, though the fine print deserves a read. Some insurers raise rates for drivers whose tracked habits score badly, and the apps collect location data that not every driver wants to share. For a driver confident in their habits, the trade usually pays.
\n\n\nThe report carries a few caveats worth knowing before you quote it at a Boston dinner party. Allstate policies cover about one in ten US drivers, so the sample is broad but not universal. City rankings follow municipal boundaries rather than metro areas, which flatters some suburbs and punishes some urban cores. And Michigan results sit apart from the rest, as the state\u2019s no-fault insurance system changes how claims are recorded. None of that changes the practical bottom line: drivers who manage speed, distance and distraction file fewer claims, and fewer claims mean cheaper insurance in every one of the 200 cities on the list.
\n\nSources:
- https://www.allstatenewsroom.com/news/2026-allstate-americas-best-drivers-report-reveals-the-safest-and-riskiest-driving-cities/
- https://www.allstate.com/best-drivers
- https://collisionweek.com/2026/07/01/brownsville-repeats-safest-driving-city-boston-riskiest-allstates-18th-best-drivers-report/

Leave a Comment
More in News

Cat A, B, S and N: What a Written-Off Car Actually Means Before You Buy One

Why Brake Fluid Needs Changing Every Two Years (and What It Costs)
Why Your Car Pulls to One Side (and What a Wheel Alignment Costs)

How to Tell if a Slow Puncture Is Repairable (and What It Costs)

How to Check and Top Up Your Car Coolant Without Damaging the Engine
Trending on Motoring Chronicle

Police Could Soon Access Your DVLA Driving Data for Any Investigation, Not Just Traffic Stops

Jeep Recalls Grand Cherokees and Wagoneers After Gear Displays Go Blank
Kia Prices New EV3 GT, EV4 GT and EV5 GT from £48,695 in the UK
How Virginia’s New AI Cameras Now Catch Drivers Running Stop Signs