
Edinburgh Drivers Paid £46.6 Million in Parking Income, Up 46 Percent in Three Years


- The City of Edinburgh Council’s published parking income lines add up to £46.6 million for 2025-26 (our sum of its figures), up 3.6% on £45.0 million in 2024-25 and 46% on £31.8 million in 2022-23.
- Parking ticket income reached £8.86 million from 181,478 tickets, an average of £48.83 a ticket, compared with £29.93 a ticket in 2022-23.
- Resident permits now bring in £4.64 million, up 55% in three years, while trade permit income is up 84% to £2.49 million.
The City of Edinburgh Council has published four years of parking income and enforcement figures, and the total for the latest financial year, 2025-26, comes to £46.6 million. That is the sum of six income lines on the council’s own parking income page: on-street payments, parking tickets, permits, bus lane notices, Low Emission Zone notices and vehicle impound charges. Adding them up is our calculation; the council does not publish a single headline total on that page.
The growth is steep when the start of the period is the comparison. In 2022-23 the same six lines came to £31.8 million. That makes the 2025-26 figure 46% higher, a rise of £14.8 million in three years. The latest year-on-year move is gentler: income rose 3.6% from £45.0 million in 2024-25. The data covers the financial year to 31 March 2026 and was read from the council’s page on 6 October 2026. The page itself carries no publication date.
For a driver, the useful number sits in the detail. Where the money comes from, and which charges have grown fastest, shows who is paying most. This article sets out each line, flags every figure we have calculated ourselves, and then covers what a driver in Edinburgh can do to cut the bill.
RingGo Now Takes 91 Percent of On-Street Payments While Cash Falls 56 Percent
On-street parking is the biggest single line. Drivers paid £25.42 million to park on Edinburgh streets in 2025-26, up from £24.80 million in 2024-25 and £19.82 million in 2022-23, a rise of 28% over three years (our calculation from the council’s three payment methods).
How drivers pay has changed completely. Payments through the RingGo app reached £23.15 million in 2025-26, which is 91% of all on-street income. Three years earlier the figure was £17.06 million, so app income is up 36%. Contactless card payments at machines rose from £0.83 million to £1.42 million, up 72%. Cash is the casualty: pay and display cash income fell from £1.94 million in 2022-23 to £0.85 million in 2025-26, a drop of 56%. Cash now makes up about 3% of on-street income.
The council’s page lists income rather than prices, so it does not show whether drivers are paying more per visit or simply parking more often through the app. What it does show is that a driver without a smartphone app or a contactless card is using a shrinking share of the system.
Parking Tickets Cost an Average of £48.83 Each, Up 63 Percent in Three Years
The council issued 181,478 parking tickets in 2025-26 and collected £8,862,052 from them. The number of tickets has barely moved in a year, down by just 18 from 181,496 in 2024-25. The money has moved: income rose 6.8% from £8,298,206.
The longer comparison is sharper. In 2022-23 the council issued 167,474 tickets and collected £5,012,086. Tickets are up 8% in three years, but the income from them is up 77%. Dividing income by tickets issued gives £48.83 a ticket in 2025-26, against £29.93 in 2022-23, a rise of 63% (our calculation). The council’s page does not say why the average has climbed, and income is not the same as the face value of each ticket, as some tickets are cancelled, paid at a discount or never collected. Still, the gap between the 8% rise in tickets and the 77% rise in income is the largest of any line on the page.
Alongside tickets sits the cost of enforcement. The council lists £8,961,518 paid to its parking enforcement contractor, NSL, in 2025-26, down from £9,084,130 in 2024-25 and up from £7,127,973 in 2022-23. Taking that contract cost away from the £46.6 million leaves about £37.6 million, compared with £35.9 million a year earlier (our calculation, and it counts only this one contract cost, not every cost of running parking).
Permits: Residents Pay 55 Percent More, Trades Pay 84 Percent More
Permit income across all five categories came to £7.60 million in 2025-26, up from £6.88 million in 2024-25 and £4.59 million in 2022-23. That is a rise of 66% in three years (our calculation).
Residents’ permits are the largest category at £4,635,782, up 55% on the £2,986,224 collected in 2022-23. Trade permits are the fastest growing: £2,485,488, up 84% on £1,348,901. Visitor permits brought in £354,217, more than double the £168,403 of three years earlier. Business and retail permits collected £110,847, up from £71,275, and healthcare permits stayed almost flat at £16,520.
The page gives income, not permit numbers or prices, so it cannot say whether the rises come from more permits being sold, higher prices, or both. A resident in a controlled zone, or a tradesperson who works across several, will know their own bill. What the figures show is that permits have grown faster than on-street payments, which rose 28%.
Bus Lanes and the Low Emission Zone: Fewer Notices, Higher Average Income
Bus lane enforcement produced 64,895 notices and £3,096,759 in 2025-26. Notices fell 19% from 80,583 in 2024-25, and income fell 13% from £3,564,436. Income per notice rose from £44.23 to £47.72 (our calculation). Compared with 2023-24, when 64,195 notices raised £1,946,478, the 2025-26 income is still 59% higher on almost the same number of notices.
The Low Emission Zone, where penalty notices began on 1 June 2024, produced 36,904 notices and £1,225,658 in 2025-26. In 2024-25, the first part-year, there were 40,945 notices and £1,072,862. Notices are down 10%, while income is up 14%, so income per notice rose from £26.20 to £33.21 (our calculation). The council’s LEZ report for 2024-25 recorded 94% of vehicles seen as compliant on average, rising above 95% by March 2025, and 77% of the contraventions it logged involved cars.
Vehicle removals are the smallest line. The council removed 1,842 vehicles in 2025-26, down from 1,880, and collected £331,010 in removal income plus £28,610 in storage charges. That is £179.70 of removal income for each vehicle moved (our calculation).
Can You Avoid It?
Most of the lines above are bills a driver can influence. These are the practical steps the council’s published rules support.
Check your vehicle before driving into the Low Emission Zone. The council uses automatic number plate recognition cameras and DVLA data to identify vehicles that do not meet the standard, and sends the notice to the registered keeper. The council’s published penalty ladder for cars and light goods vehicles is £60 for a first notice, £120 for a second, £240 for a third and £480 for a fourth and any after that. Only one notice is issued per vehicle in a 24-hour period.
Pay LEZ notices early. The council says it reduces all PCNs by 50% if they are paid within 14 days, which turns a £60 notice into £30. The payment deadline is 28 days. After that, a charge certificate is issued, and the council says this increases the penalty charge by 50%. A £60 notice that reaches a charge certificate becomes £90.
Challenge a notice you think is wrong. The council’s LEZ page has a section on challenging a penalty charge notice, and each parking notice carries its own deadline and instructions. Read the dates printed on the notice first, as they set how long you have to act.
Use the app or contactless card where you can. With 91% of on-street income now arriving through RingGo, the app is the main route in Edinburgh. Pay for the full length of stay you need and set a reminder on your phone before it ends, as the average ticket in 2025-26 produced £48.83 of income.
Check permit categories before renewing. The council runs separate residents, visitors, trades, healthcare and business and retail permits. Trade and visitor permits are among the fastest-growing lines, so work out whether the category you hold matches how you actually use it.
Stay out of bus lanes when they are in operation. Bus lane notices fell 19% in 2025-26, from 80,583 to 64,895, and the council’s income from them fell 13%.
What the Figures Do Not Show
The council’s page lists income and notice numbers. It does not publish prices, the share of notices that are cancelled, or what the money is spent on. The start point changes the size of the rise. Measured from 2023-24 instead of 2022-23, total income is up 20%, from £38.7 million to £46.6 million (our calculation).
The latest year-on-year movement is mixed. Parking ticket income, permits, on-street payments and Low Emission Zone income all rose. Bus lane income fell 13% and the enforcement contract cost fell 1.4%. The overall total rose 3.6%, a much smaller move than the three-year climb. Whether the next set of figures shows income levelling off or climbing again will be clear when the council updates the page for 2026-27.
Sources
- City of Edinburgh Council, Parking income and enforcement data, 2022-23 to 2025-26 (edinburgh.gov.uk/parkingincome), accessed 6 October 2026.
- City of Edinburgh Council, Low Emission Zone penalty charges page (edinburgh.gov.uk), accessed 6 October 2026.
- City of Edinburgh Council, Low Emission Zone report 2024 to 2025.
- All totals, percentages and per-ticket or per-notice averages marked “our calculation” were worked out by Motoring Chronicle from the council’s published figures.

Leave a Comment
More in News
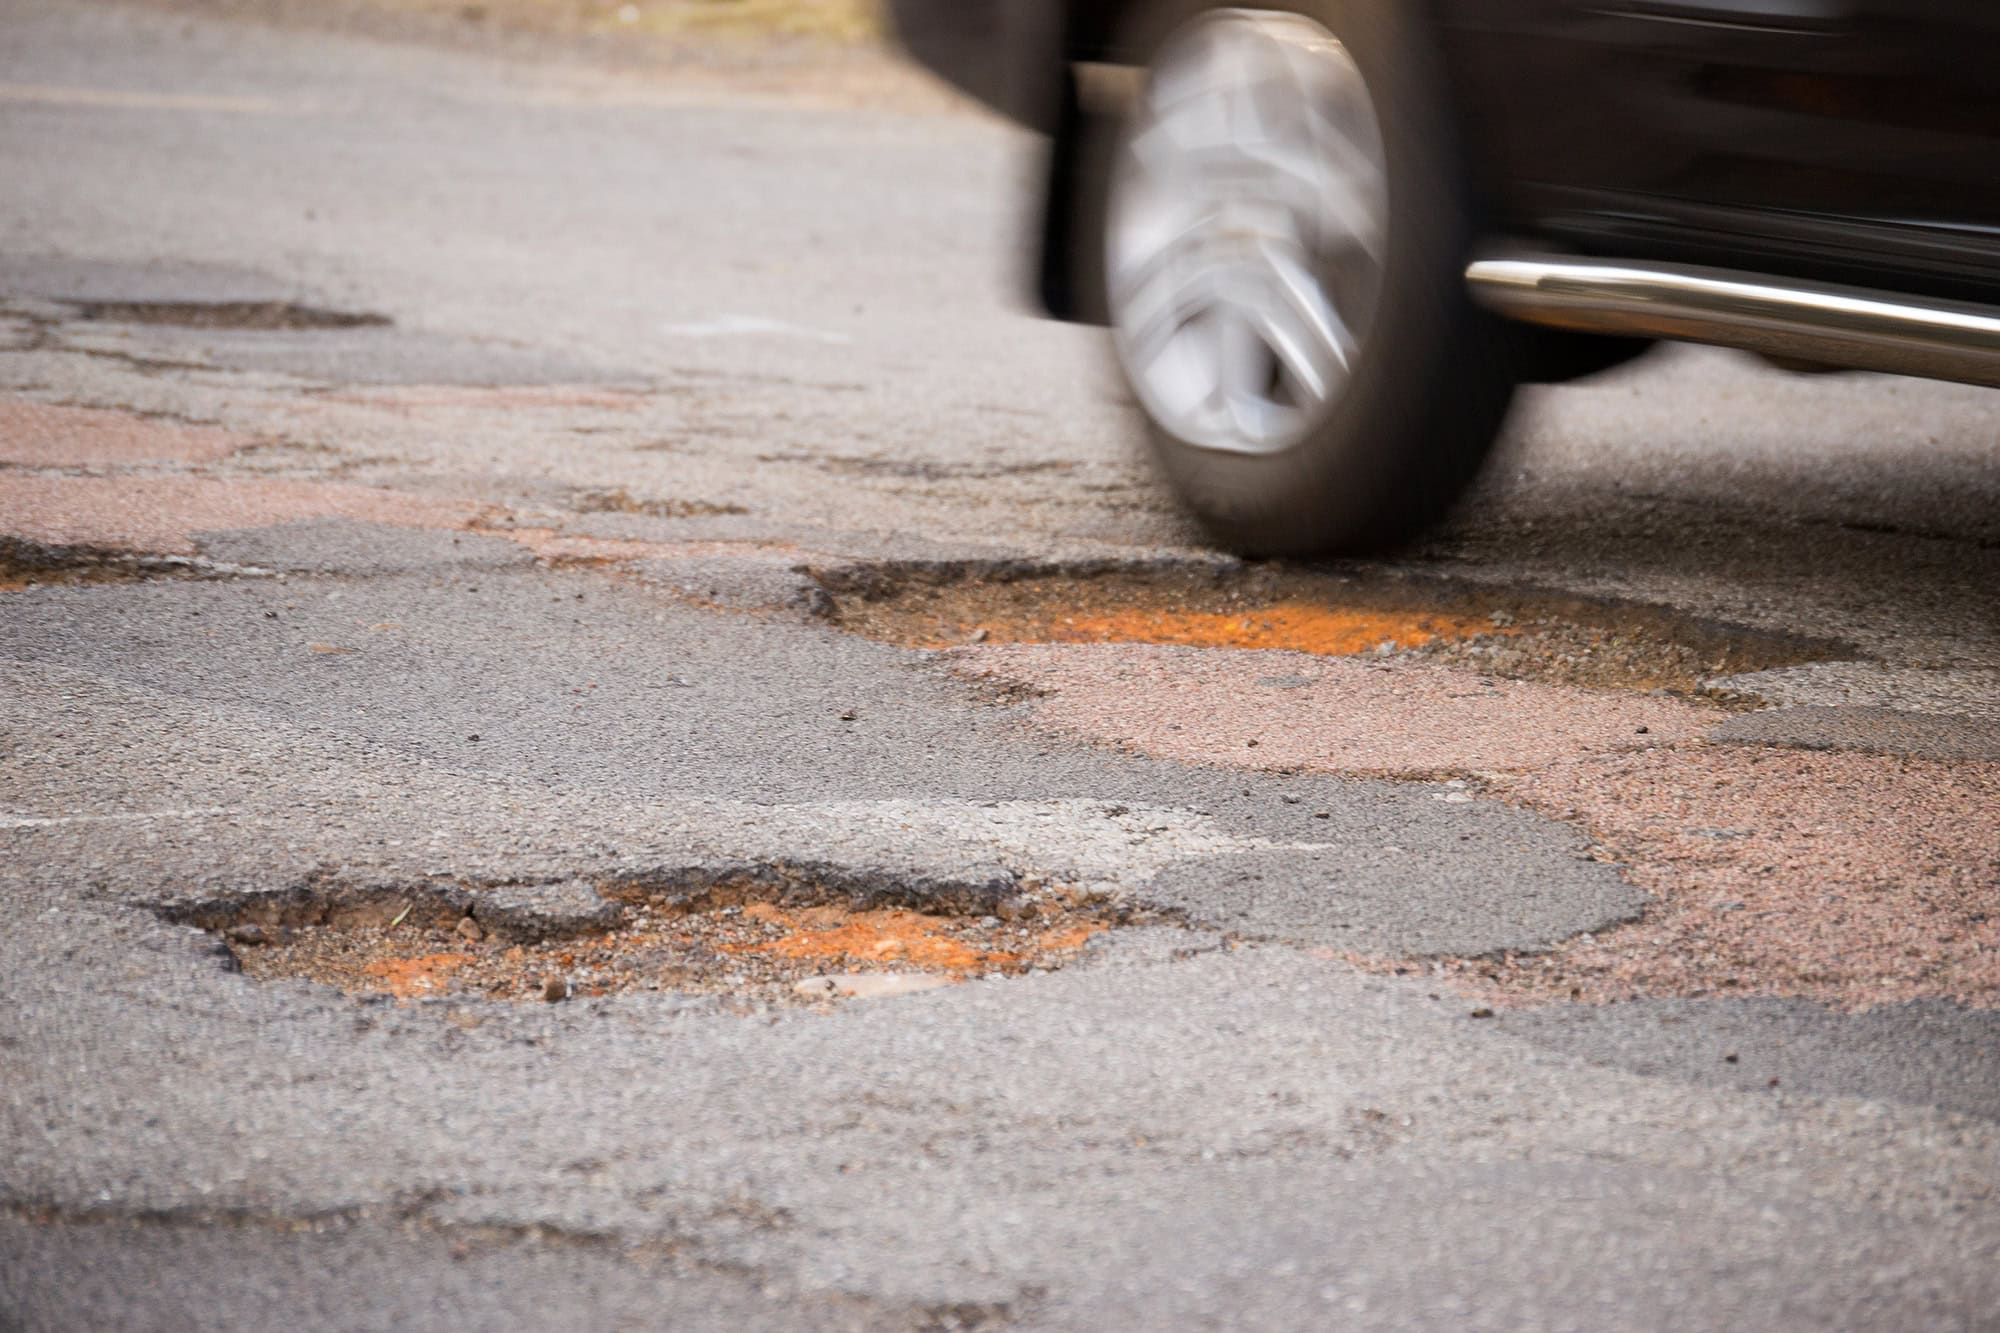
Drivers Claimed £10.2 Million for Pothole Damage but County Councils Paid 6%, Quotezone Shows
Car Insurance Bills Rose by £8 This Quarter as a Two-Year Price Drop Ends

Garage Complaints to the Motor Ombudsman Jumped 22 Percent as Payouts Hit £4,308

How Cap HPI Data Shows Some Used Electric Cars Losing 29 Percent of Value
POPLA Cancelled Nearly Half of 107,000 Parking Fines UK Drivers Challenged
Trending on Motoring Chronicle

Wheel Bearing Noise: How Long Can You Really Keep Driving?

Oklahoma Has the Least Reliable EV Chargers in the US, New Report Finds

Audi A6 Wins IIHS Top Safety Pick+ Award, Most of Any Luxury Brand

BookMyGarage Data Shows Drivers Now Pay £425 to Fix a Failed MOT
