
The Age Your Car Starts Failing Its MOT, According to 33 Million Tests


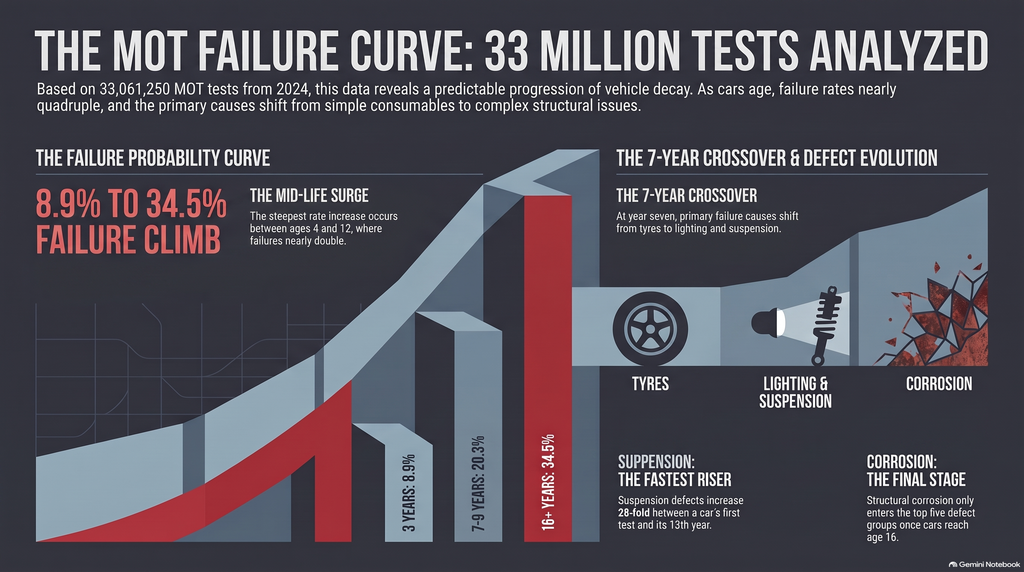
MOT failure rates climb from 8.86 per cent on the youngest cars tested to 34.50 per cent on cars aged 16 or more, from our analysis of the 33,061,250 car tests carried out in 2024. The climb is not steady. One stage of a car’s life shifts the odds more sharply than any other, and it arrives earlier than most owners would guess. What fails changes as well as how often, and the fault heading the list on a nearly new car is not the one heading it on an old one.
Key takeaways:
- The curve in one line: 8.9 per cent of cars fail at three years old, 20.3 per cent at seven to nine, and 34.5 per cent at 16 or more.
- The mix of faults shifts from consumables to wear items as a car ages, which changes what a check before the test is worth.
- Corrosion enters the five most common defect groups only on cars aged 16 and over.
The Curve, Band by Band
These figures come from our own processing of the raw test records rather than the published summary tables. The failure rate at each age of car, and the defect mix inside each band, are not numbers anyone puts out ready-made.
One caveat belongs at the top rather than buried at the bottom. This is an association between age and test results, not proof that age causes failures. Older cars are also cheaper cars, owned by people with less to spend on them and driven differently, and no amount of test data separates those things.
What We Counted
The set is 33,061,250 class 4 tests carried out in 2024, class 4 being the category almost every car sits in. Normal tests only, with retests left out, so each record is a car arriving for its annual check. The source is DVSA’s anonymised MOT data.
Age was calculated from each car’s date of first use to the date of its test. A small number of records, 17,071 or 0.05 per cent of the total, were set aside for missing or implausible first use dates.
The overall final failure rate across the set is 22.80 per cent, which reconciles with DVSA’s published figure to within 0.01 percentage points. That agreement on the headline number is what gives the breakdown underneath it its weight.
One band needs explaining before the numbers start. Cars are first tested at three years old, so the under-three band is not a population of ordinary young cars. It is mostly taxis and private hire vehicles, which sit in class 4 and are tested from one year old.
From One in Eleven to One in Three
Cars under three failed at 8.86 per cent across 1,511,990 tests. At three years old, the first test for most cars, the rate is 9.68 per cent of 1,755,302 tests, or fewer than one car in ten.
From four to six the rate reaches 13.12 per cent across 6,996,998 tests. From seven to nine it is 20.27 per cent of 7,756,765 tests, and from 10 to 12 it climbs to 27.78 per cent of 5,795,584.
The steepest part of the curve sits in the middle of a car’s life rather than at the end. Between the four to six band and the 10 to 12 band the rate roughly doubles, adding a little under 15 percentage points across six years of ownership.
Initial rates, which count cars put right at the station before the result was issued, run higher at every age: 16.78 per cent at four to six, 25.16 per cent at seven to nine and 34.28 per cent at 10 to 12.
Where the Curve Flattens
At the top the climb stops. Cars aged 13 to 15 failed at 33.26 per cent across 4,242,490 tests, and cars aged 16 or more at 34.50 per cent across 4,985,050, a gap of barely more than a point after several more years of wear.
Several readings fit that. The cars still being presented at 16 and over are survivors, kept on the road by owners willing to spend on them. Cars in poor condition leave the road rather than turning up and failing. A well kept older car is also a different proposition from an average one of the same age.
Nothing in the data picks between those explanations, and we are not going to pretend otherwise. What the figures do show is that the change between a five-year-old car and a twelve-year-old one is far larger than anything that happens after that.
Seven Years, and What Changes
How often a car fails is half the story. What it fails on changes as well, and the switch happens at a specific point in a car’s life. The ranking of the faults that fail cars across the whole fleet looks quite different once the data is cut by age.
One point applies to everything below. A test can carry several defects at once, so the group shares inside each band overlap and do not add up to that band’s failure rate.
Tyres Own the First Six Years
Tyres lead the defect groups on every band up to six years old. They appear in 5.03 per cent of tests on cars under three, 4.81 per cent at three years old and 5.45 per cent at four to six.
Nothing else comes close at that age. Lighting sits at 2.82 per cent on the under-three band and visibility at 2.73 per cent, with suspension almost absent at 0.58 per cent.
The reason is plain enough. A young car has covered all its mileage in a short space of time, its electrics and suspension are intact, and the only parts near the end of their life are the ones touching the road. Tyre tread below the 1.6mm limit is the single most common defect anywhere in the data, at 759,464 failed tests.
From Seven, Lighting Leads
At seven to nine years the order changes. Lighting takes the top spot at 7.81 per cent of tests in that band, with suspension second at 6.74 per cent and tyres pushed into third at 6.71 per cent.
Lighting keeps the lead for the rest of a car’s life and widens it: 14.05 per cent at 10 to 12, 18.84 per cent at 13 to 15 and 20.57 per cent at 16 or more. At that age, one car in five carries a lighting defect the tester writes down.
Suspension climbs alongside it, reaching 11.99 per cent at 10 to 12 and 16.25 per cent from 13 years onwards. Across the whole fleet, lighting defects appear in 10.99 per cent of tests and in 48.22 per cent of failed tests.
The Cars That Cross Over
For an owner, the crossover changes what a check before the test is worth. Under seven years, the driveway covers it. Lights walked through with a helper, tread checked with a 20p coin, wipers and washers between them account for most of what fails cars of that age.
From seven, the faults move underneath the car, where nothing can be judged with the wheels on the ground. Springs, ball joints, bushes and pad thickness start deciding the result, and a worn wheel bearing will have been humming on the road for months before a tester finds play in it.
Covering that is a question of timing rather than spending. A service, a tyre change or a brake job puts the car on a ramp anyway, and asking for the suspension, boots and pads to be looked at while it is up there costs nothing extra.
The Faults That Arrive With Age
Three defect groups account for most of the difference between a young car and an old one, and they arrive in a fixed order: suspension first, brakes alongside it, corrosion last of all.
Suspension, the Fastest Riser
Suspension is the clearest age signal in the data. It appears in 0.58 per cent of tests on cars under three and 16.25 per cent on cars from 13 years onwards, roughly twenty-eight times the rate.
The climb is orderly rather than sudden: 0.83 per cent at three years old, 2.25 per cent at four to six, 6.74 per cent at seven to nine, then 11.99 per cent at 10 to 12.
Springs, ball joints and bushes wear on time and road surface as much as mileage, and British roads are unkind to all three. None of them gives an owner much notice, which is why they arrive as a surprise on a test certificate rather than as a symptom.
Brakes and Visibility
Brake defects follow a similar path, rising from 1.53 per cent of tests on the youngest cars to 12.80 per cent at 16 or more, with the steepest section between four and twelve years: 3.25 per cent at four to six, 5.31 at seven to nine, 7.87 at 10 to 12.
Visibility behaves differently from everything else. It sits in the top five at every age, from 2.73 per cent under three to 6.26 per cent at 13 to 15, a far gentler rise. Wipers, washers and screen damage happen to cars of any age.
That makes visibility the one group where a young car is nearly as exposed as an old one. It is also the cheapest group on the list to put right before a test.
Corrosion, the Last to Show
Body, chassis and structure defects enter the top five only on cars aged 16 or more, where they appear in 8.75 per cent of tests in that band. At every younger age, other groups outrank them.
Corrosion takes years of wet and salt to reach the point a tester records it, which is why it is missing from the younger bands entirely. It is the slowest fault in the data to arrive.
It is also the fault that ends cars rather than failing them. A bulb, a tyre or a ball joint is a repair with a price attached. Corrosion in a prescribed area means cutting and welding, at a labour cost that soon passes what a car of that age is worth.
What the Curve Is Worth Knowing For
A base rate turns a test result into an expectation. An owner who knows the odds for a car of their age can prepare for the right faults, and read a fail for what it is rather than as a verdict on their luck.
If You Own the Car
Under seven years, match the check to the faults that actually fail cars of that age. Tread across the full width of all four tyres, every lamp including the number plate light, wipers that clear the screen without smearing.
From seven, add the underside. A garage check on suspension, pads and boots a few weeks before the test, while the car is up for something else, catches the faults that now decide the result and leaves time to fix them.
A fail on an older car is not bad luck, and it is not a tester on a mission. At 13 to 15 years a third of cars fail, and at 16 and over the rate is 34.50 per cent. That is the base rate for a car of that age, and a clean pass at 16 is the outcome worth being pleased about.
If You Are Buying One
Read the curve as a cost forecast. A ten-year-old car is not a bad buy, and plenty of them are looked after better than cars half their age, but its MOT is close to a one-in-four proposition every year and that belongs in the running costs.
The faults on that side of the crossover are labour rather than parts. Springs, ball joints, bushes and brake work all carry more hours than component cost, which is why bills at that age look large next to the value of the part fitted.
The MOT history shows which side of the curve a particular car sits on. A run of clean passes on a twelve-year-old car says more than a fresh certificate on a five-year-old one, and the advisories from the last two tests are a preview of the next bill.
If you enjoyed this article, be sure to follow us on Microsoft Start.
MOT Failure FAQs
How common is it for cars to fail MOT?
About one car in four fails. Our analysis of the 33,061,250 class 4 tests carried out in 2024 puts the final failure rate at 22.80 per cent, with 7,537,781 cars failing outright. A second figure of 28.28 per cent, the initial failure rate, counts cars that arrived with a defect serious enough to fail but were put right at the test station before the result was issued, which is why different sources quote different numbers. Neither figure applies evenly across the fleet: a three-year-old car fails at 9.68 per cent, while a car of 16 or more fails at 34.50 per cent.
What are the most common reasons for a car to fail its MOT test?
Lighting is the most common area, and tyre tread is the most common single fault. Lighting and electrical defects appear in 48.22 per cent of failed tests, though many cars failing on a bulb are failing on other things at the same time. The single defect recorded most often is tyre tread below the legal minimum, at 759,464 failed tests, followed by a fractured or seriously weakened spring at 671,922, brake linings or pads below 1.5mm at 606,408, a lamp missing or inoperative at 575,748 and a wiper blade not clearing the screen at 495,197. Not one of the thirteen most common defects involves the engine or the gearbox.
Will my car fail MOT with bald tyres?
Yes, and it will be recorded as a dangerous defect rather than an ordinary fail. The requirement is at least 1.6mm of tread in a continuous band across the central three-quarters of the tyre and around its whole circumference, so the outer quarter on each side can legally be bald while the middle is not. Tread below that limit accounted for 759,464 failed tests in 2024, and a further 5,308,869 tests picked up an advisory for tread approaching the limit, which is the warning that arrives a year before the failure does.
Can I drive my car away if it fails an MOT?
Only if the old certificate has not yet run out and no dangerous defect was recorded, and the car must still meet the minimum standards of roadworthiness. GOV.UK sets out that a car failing with a dangerous defect should not be driven until it has been repaired, whatever the certificate in the glovebox says, and driving one that has failed on those grounds can bring a fine of up to £2,500, three penalty points and a driving ban. Dangerous items were recorded on 7.83 per cent of tests in 2024, which is nearly one car in thirteen.
Does a failed MOT devalue a car?
A fail does not change a car’s book value, but it is permanent and public, which can change what a buyer offers. Every test result stays on the MOT history that anyone can look up with the registration, so a private buyer can see a failure from four years ago along with the mileage recorded at the time and every advisory. One fail on an otherwise clean record carries little weight. A pattern of them, repeated advisories for the same fault, or a failure for corrosion on an older car tells a buyer that money is owed on the car, and that is what moves the price.

Leave a Comment
More in News

Why Your Car Battery Gives No Warning Before It Dies and the Two Signs Drivers Always Miss

Why Battery Health Now Decides What a Used Electric Car Is Worth

How to Avoid Losing Your Deposit When a Used Car Dealer Goes Under

What Actually Ruins Car Paint and How to Stop It Without Paying for a Detailer
Every Insured Driver in Britain Pays Extra for the 300,000 Uninsured Cars on the Road Each Day
Trending on Motoring Chronicle
The Importance of Wheel Alignment: Ensuring Vehicle Safety and Performance

Paying Your Car Insurance Monthly Could Cost You Almost 30 Percent in Hidden Interest

Caravan and Motorhome Tyre Failures Drive a 16 Percent Rise in Towing Breakdowns

Disabled Drivers on New Motability Leases Face VAT Charges and Lower Mileage Caps
